Free Access
Fig. 46
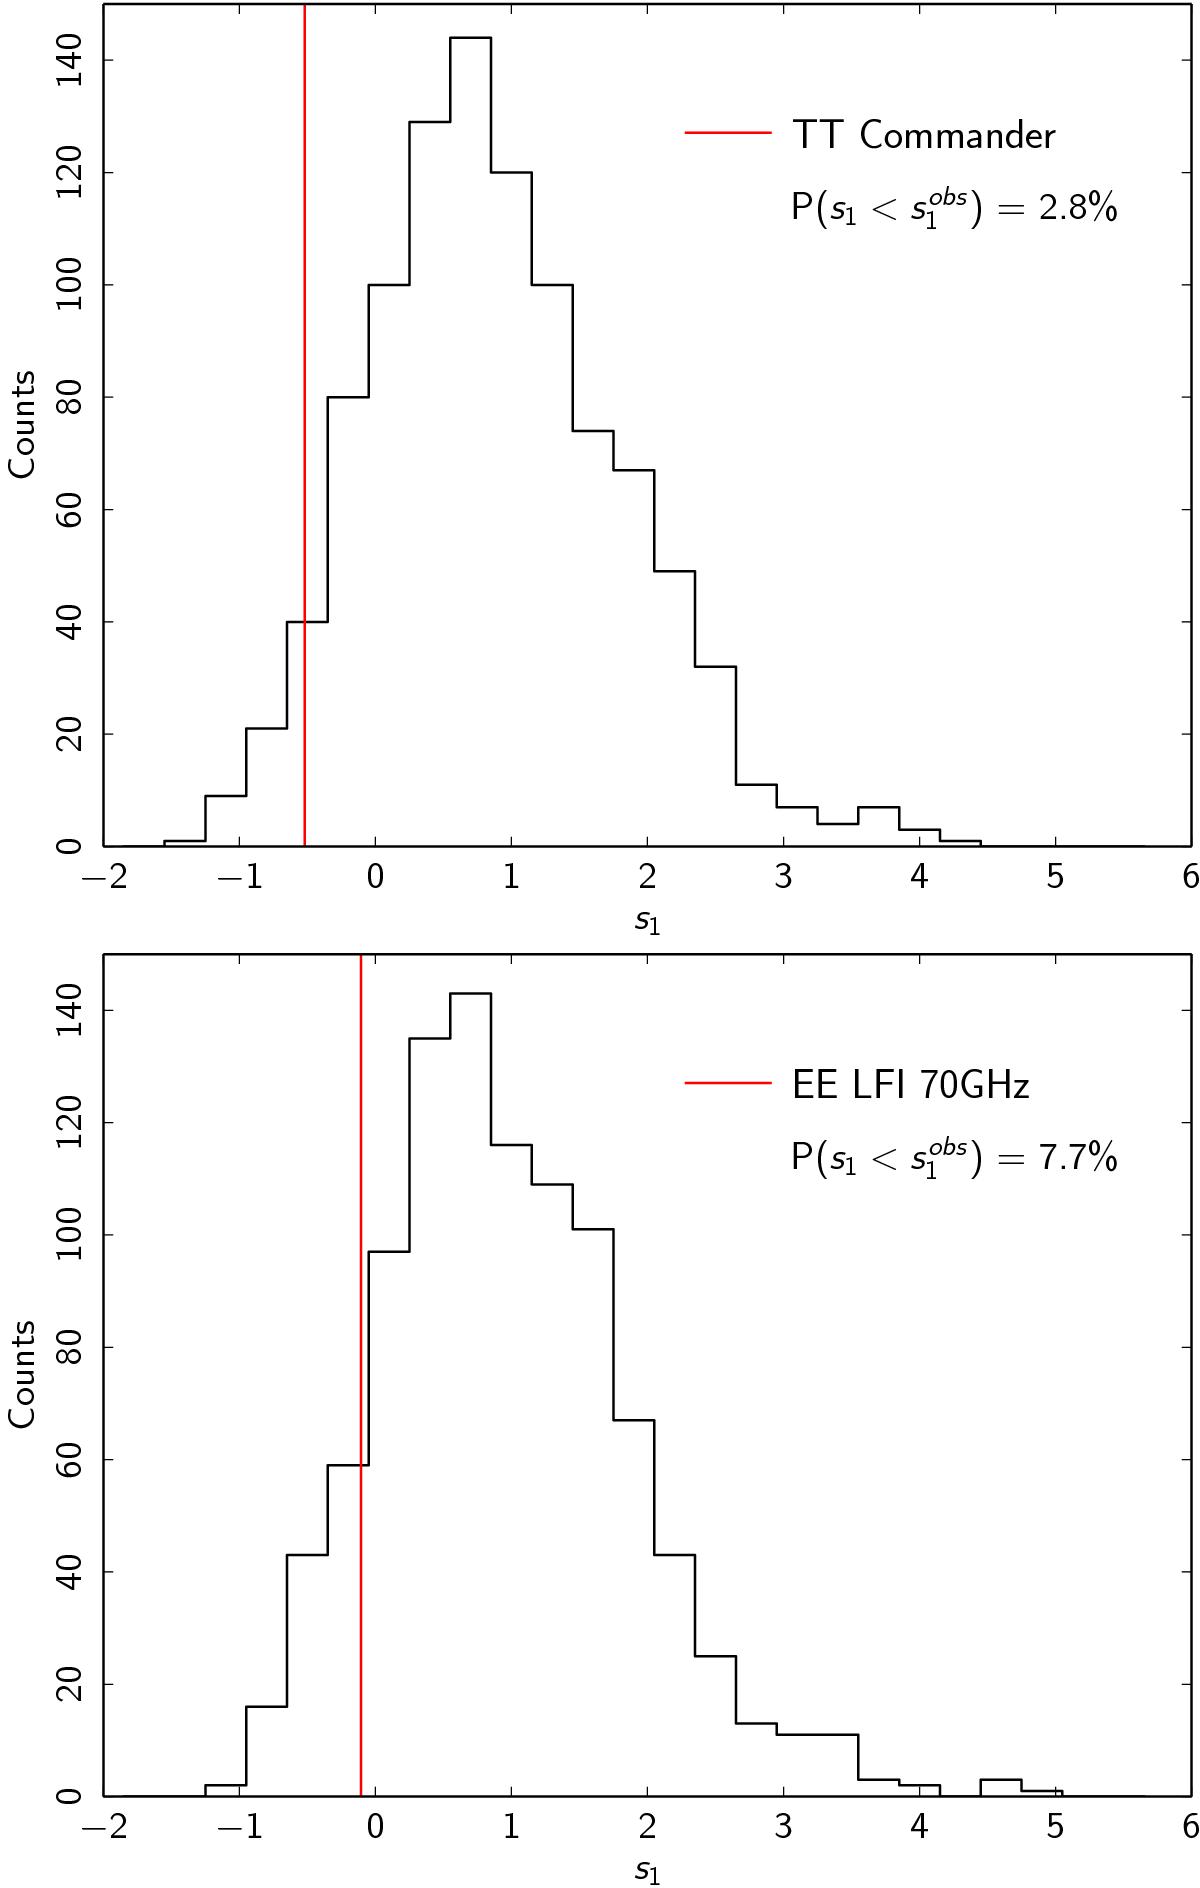
Top: empirical distribution for the Hausman s1 statistic for TT derived from simulations; the vertical bar is the observed value for the PlanckCommander map. Bottom: the empirical distribution of s1 for EE and the Planck 70 GHz polarization maps described in Sect. 2.
This figure is made of several images, please see below:
Current usage metrics show cumulative count of Article Views (full-text article views including HTML views, PDF and ePub downloads, according to the available data) and Abstracts Views on Vision4Press platform.
Data correspond to usage on the plateform after 2015. The current usage metrics is available 48-96 hours after online publication and is updated daily on week days.
Initial download of the metrics may take a while.