Fig. 41
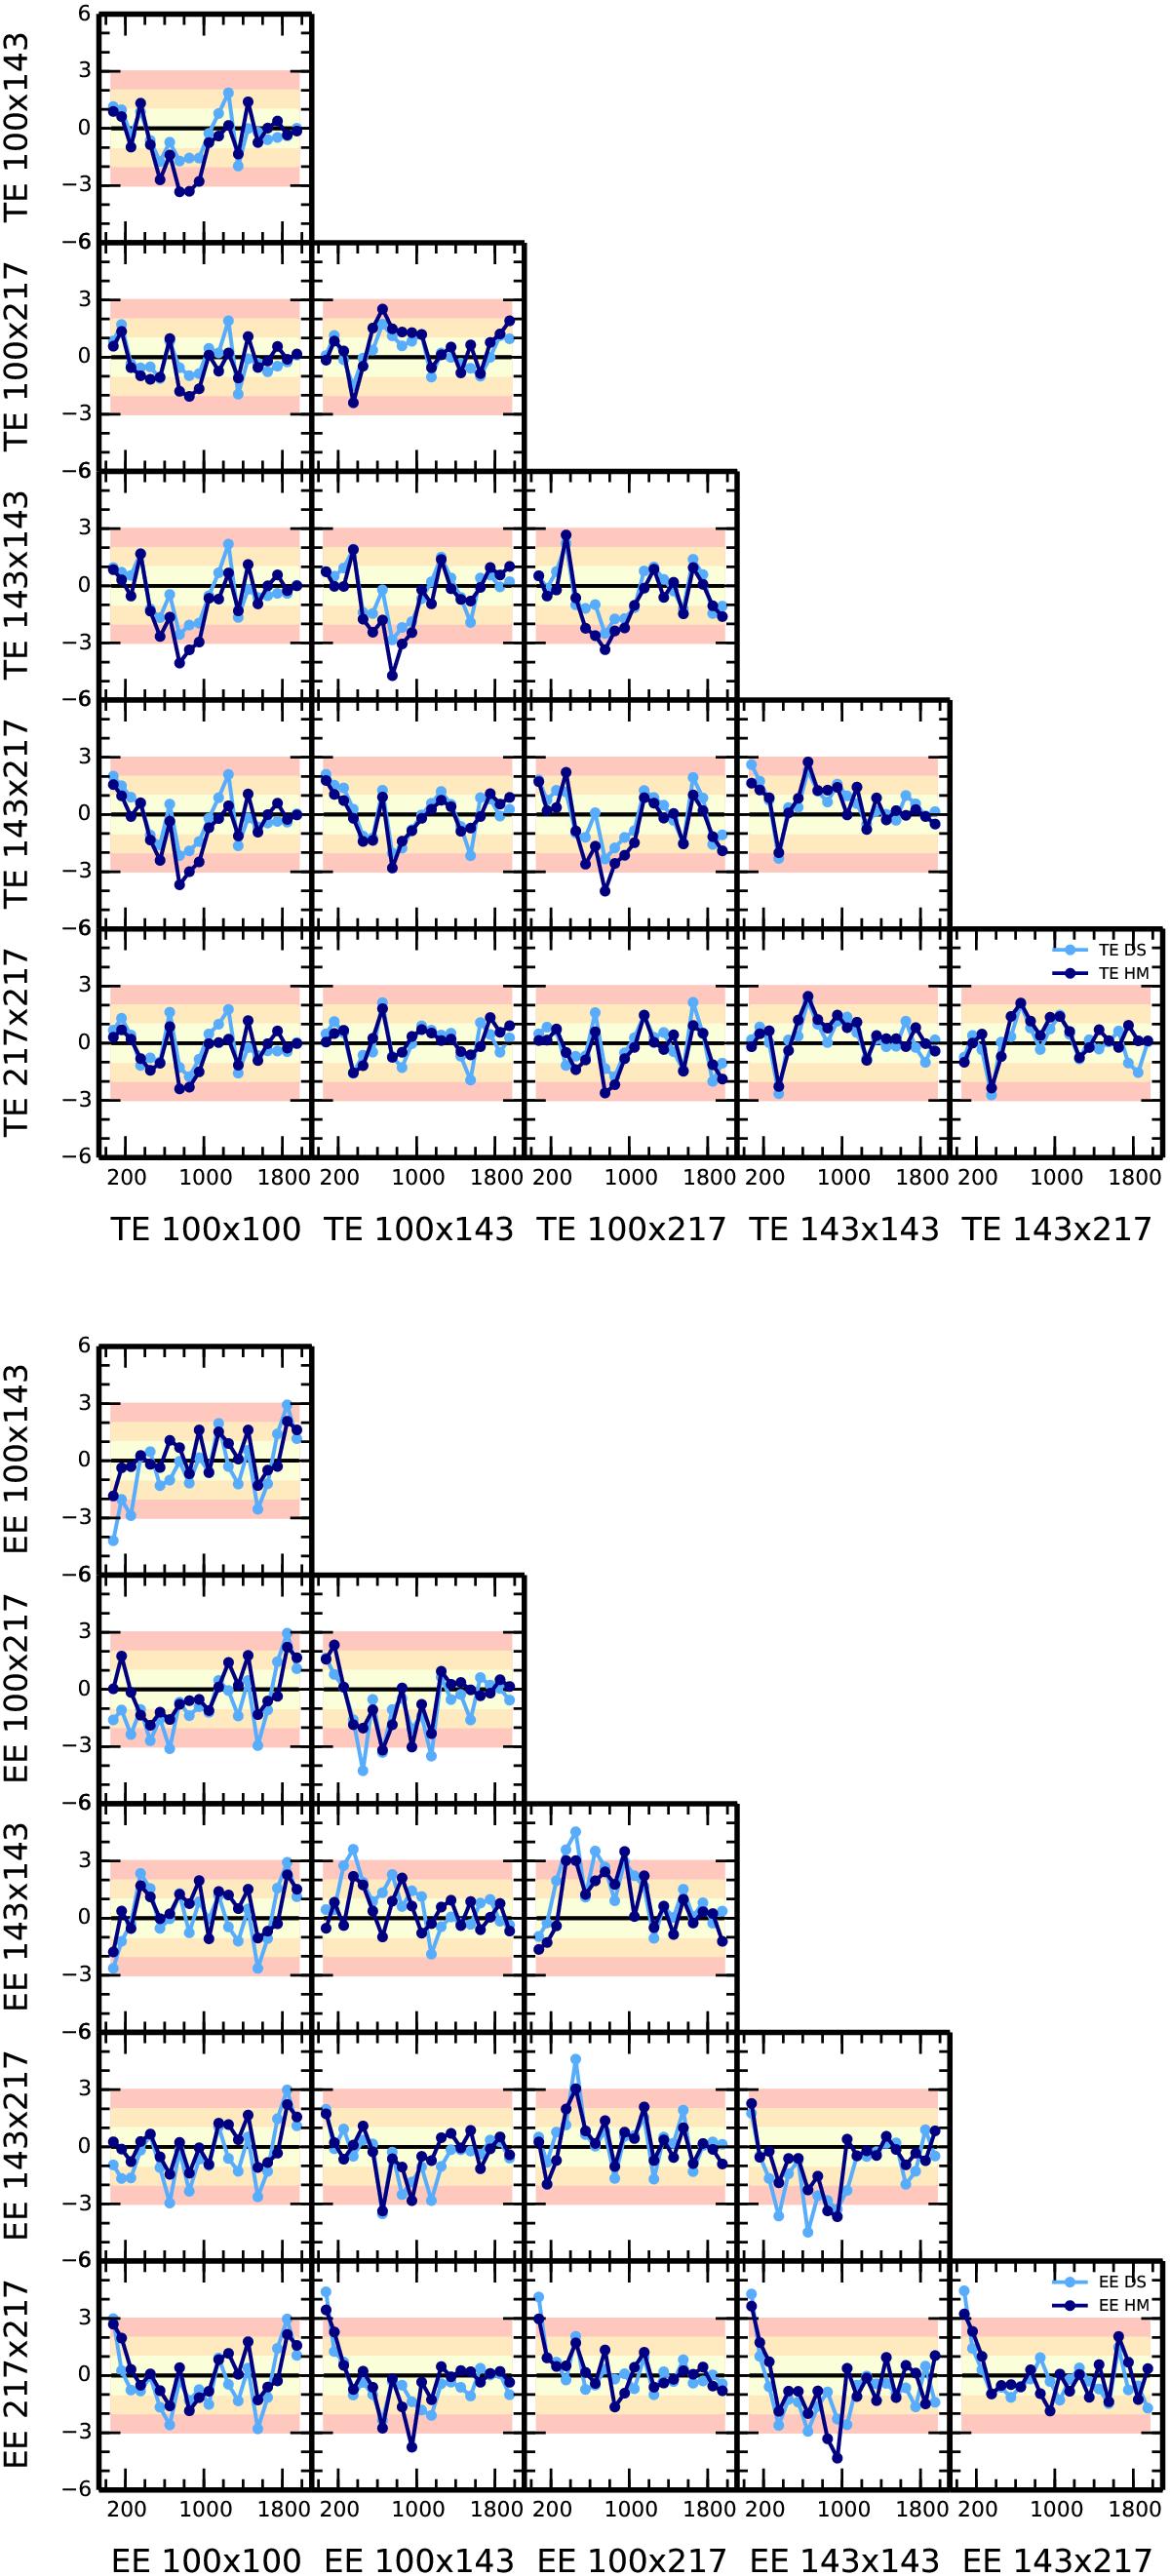
Inter-frequency foreground-cleaned power-spectra differences. Each panel shows the difference of two frequency power spectra, that indicated on the left axis minus that on the bottom axis, after subtracting foregrounds using the best-fit PlanckTT+lowP foreground solutions. Differences are shown for both the HM power spectra (dark blue) and the DS power spectra (light blue).
Current usage metrics show cumulative count of Article Views (full-text article views including HTML views, PDF and ePub downloads, according to the available data) and Abstracts Views on Vision4Press platform.
Data correspond to usage on the plateform after 2015. The current usage metrics is available 48-96 hours after online publication and is updated daily on week days.
Initial download of the metrics may take a while.