Fig. 40
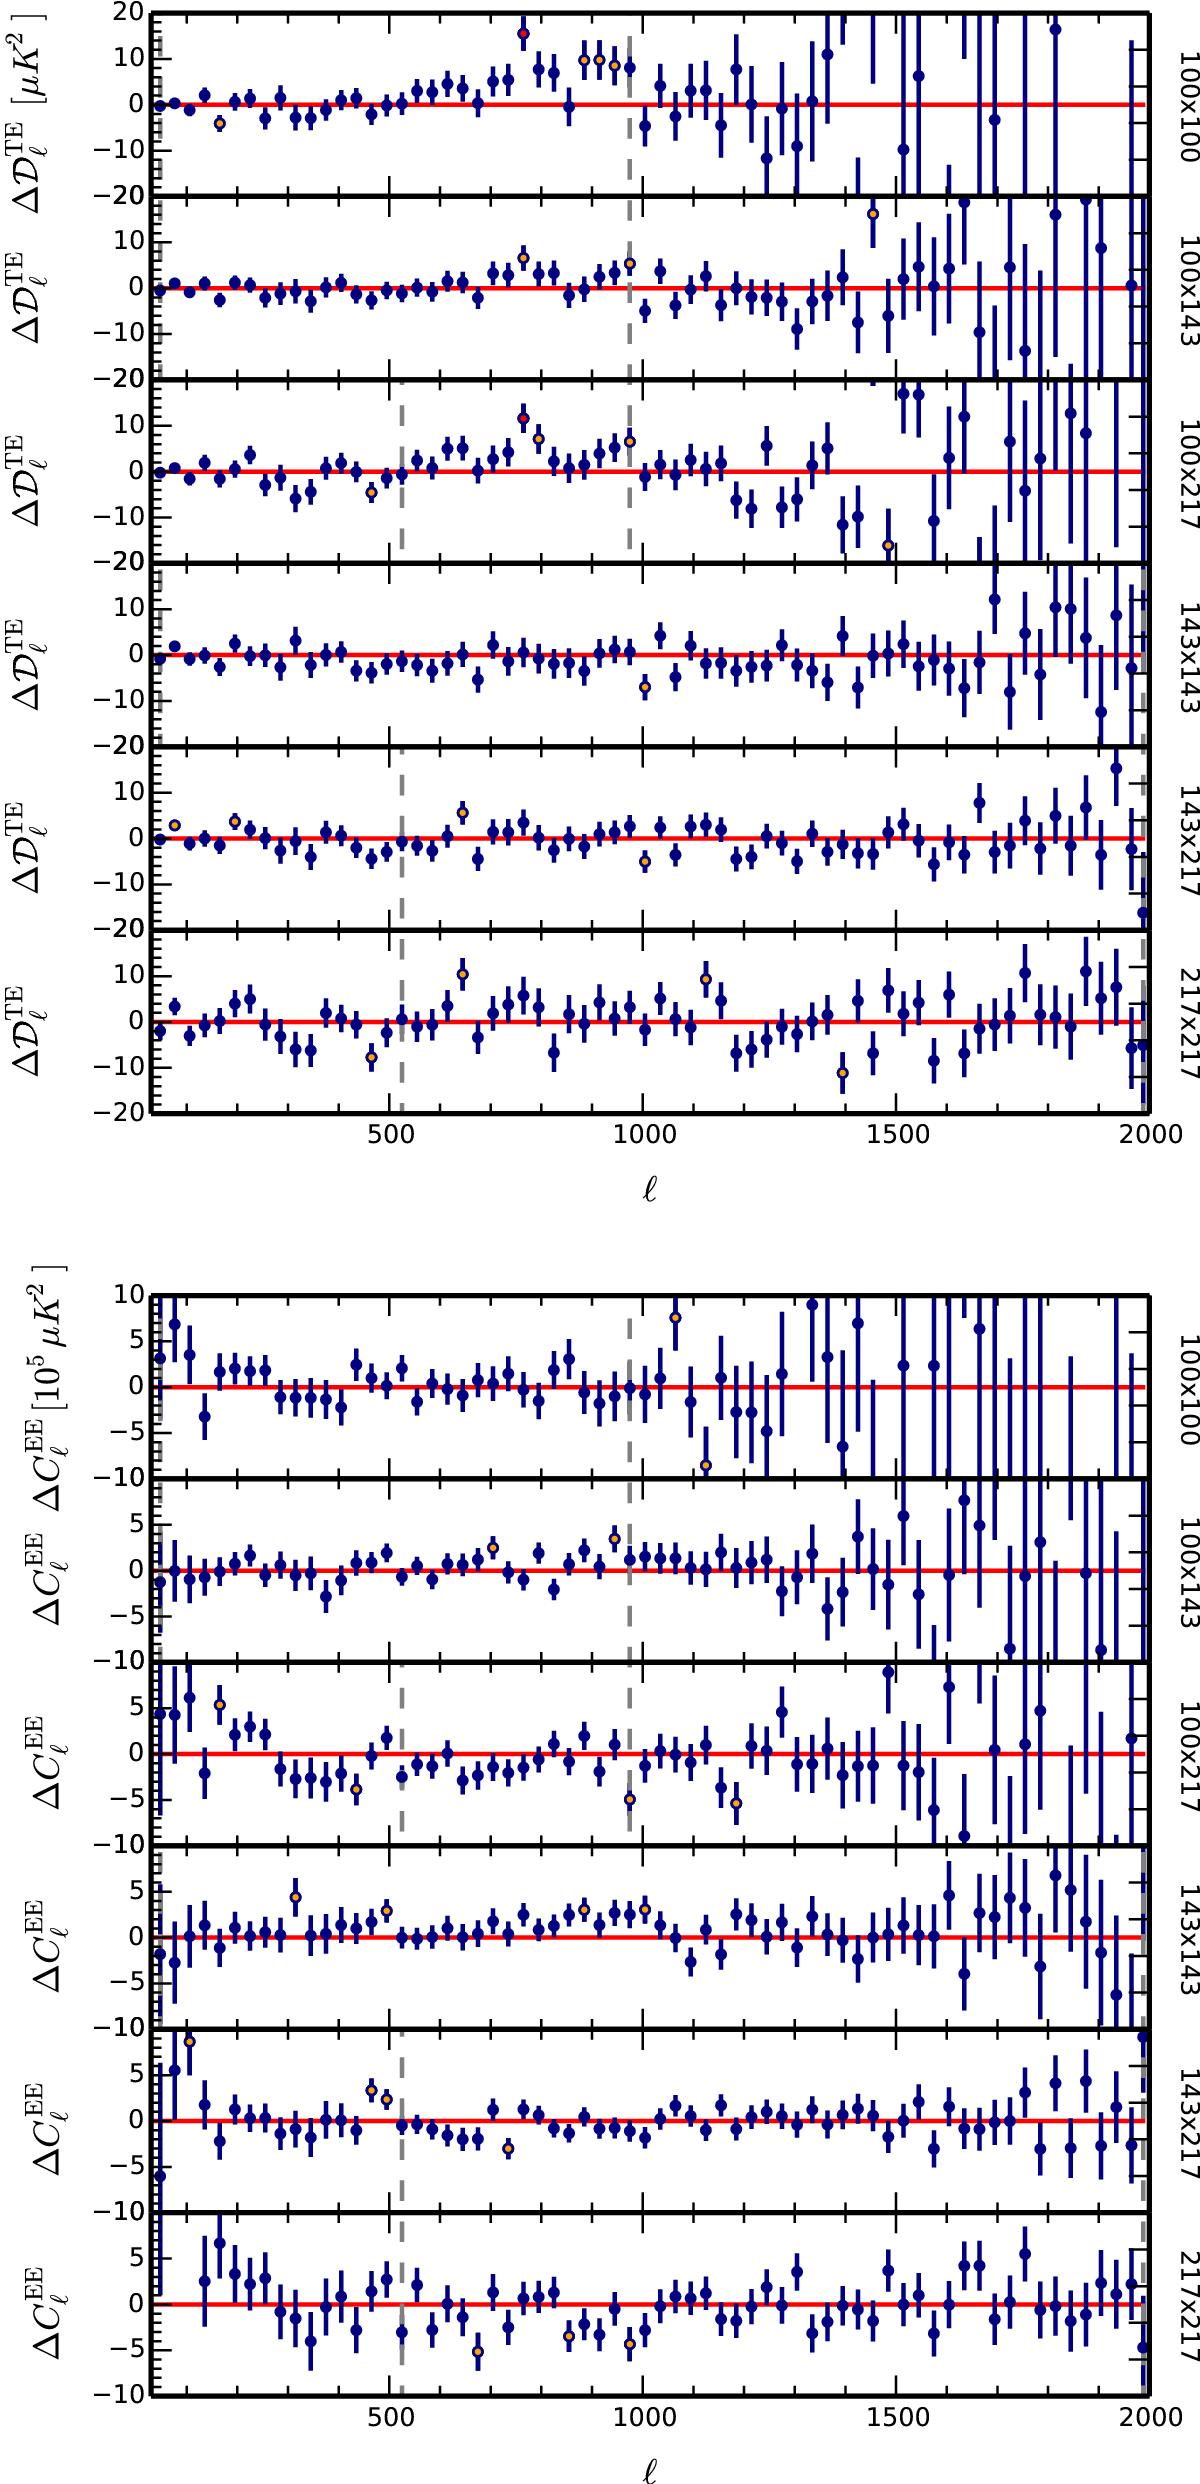
Residual frequency power spectra after subtraction of the Plik TT+tauprior best-fit model. We clean Galactic dust from the spectra from using the best-fit solution of Plik TT, TE, EE+tauprior. The residuals are relative to the baseline HM power spectra (blue points, except for those that deviate by at least 2 or 3σ, which are shown in orange or red, respectively). The vertical dashed lines delimit the ℓ ranges retained in the likelihood. Upper: TE power spectra. Lower: EE power spectra.
Current usage metrics show cumulative count of Article Views (full-text article views including HTML views, PDF and ePub downloads, according to the available data) and Abstracts Views on Vision4Press platform.
Data correspond to usage on the plateform after 2015. The current usage metrics is available 48-96 hours after online publication and is updated daily on week days.
Initial download of the metrics may take a while.