Fig. 4
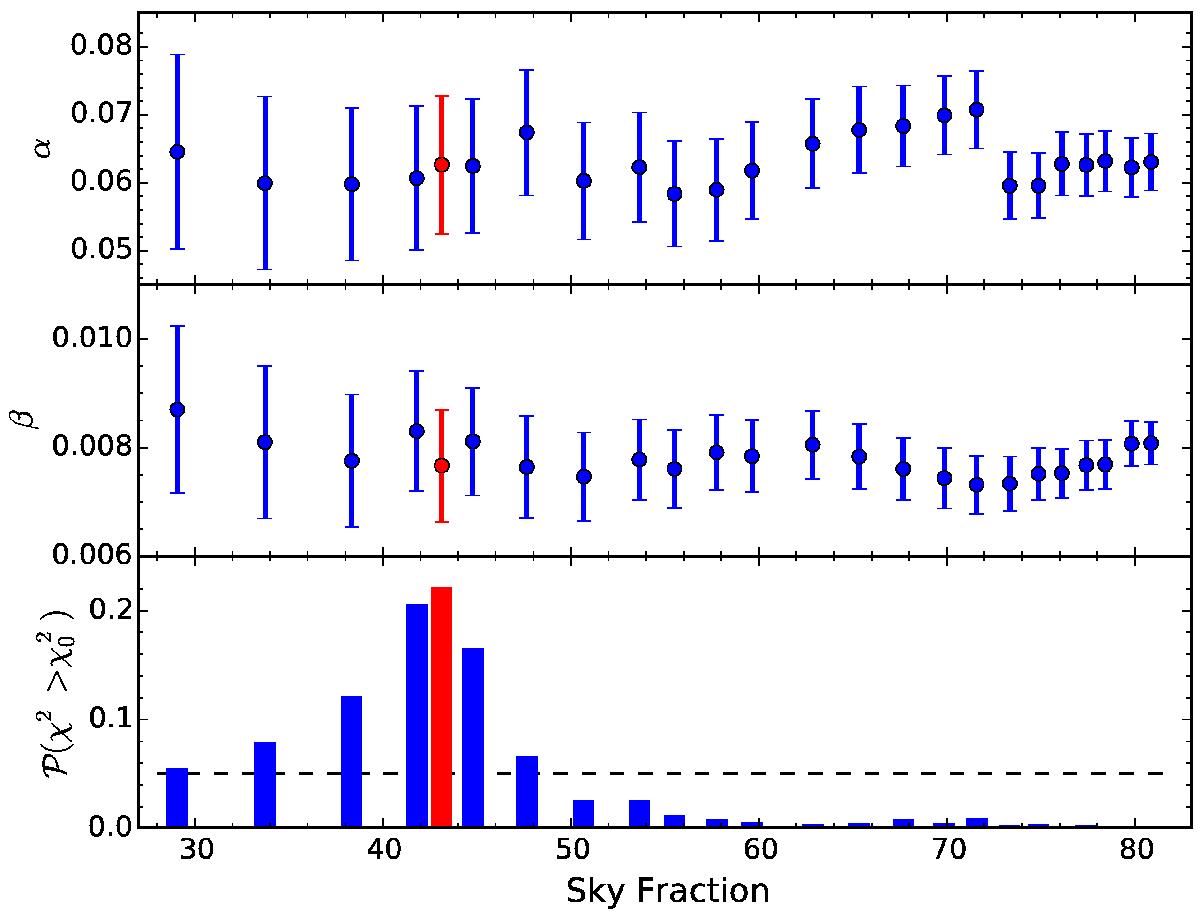
Upper panels: estimated best-fit scaling coefficients for synchrotron (α) and dust (β), for several masks, whose sky fractions are displayed along the bottom horizontal axis (see text). Lower panel: the probability to exceed, ![]() . The red symbols identify the mask from which the final scalings are estimated, but note how the latter are roughly stable over the range of sky fractions. Choosing such a large “processing” mask ensures that the associated errors are conservative.
. The red symbols identify the mask from which the final scalings are estimated, but note how the latter are roughly stable over the range of sky fractions. Choosing such a large “processing” mask ensures that the associated errors are conservative.
Current usage metrics show cumulative count of Article Views (full-text article views including HTML views, PDF and ePub downloads, according to the available data) and Abstracts Views on Vision4Press platform.
Data correspond to usage on the plateform after 2015. The current usage metrics is available 48-96 hours after online publication and is updated daily on week days.
Initial download of the metrics may take a while.