Free Access
Fig. 39
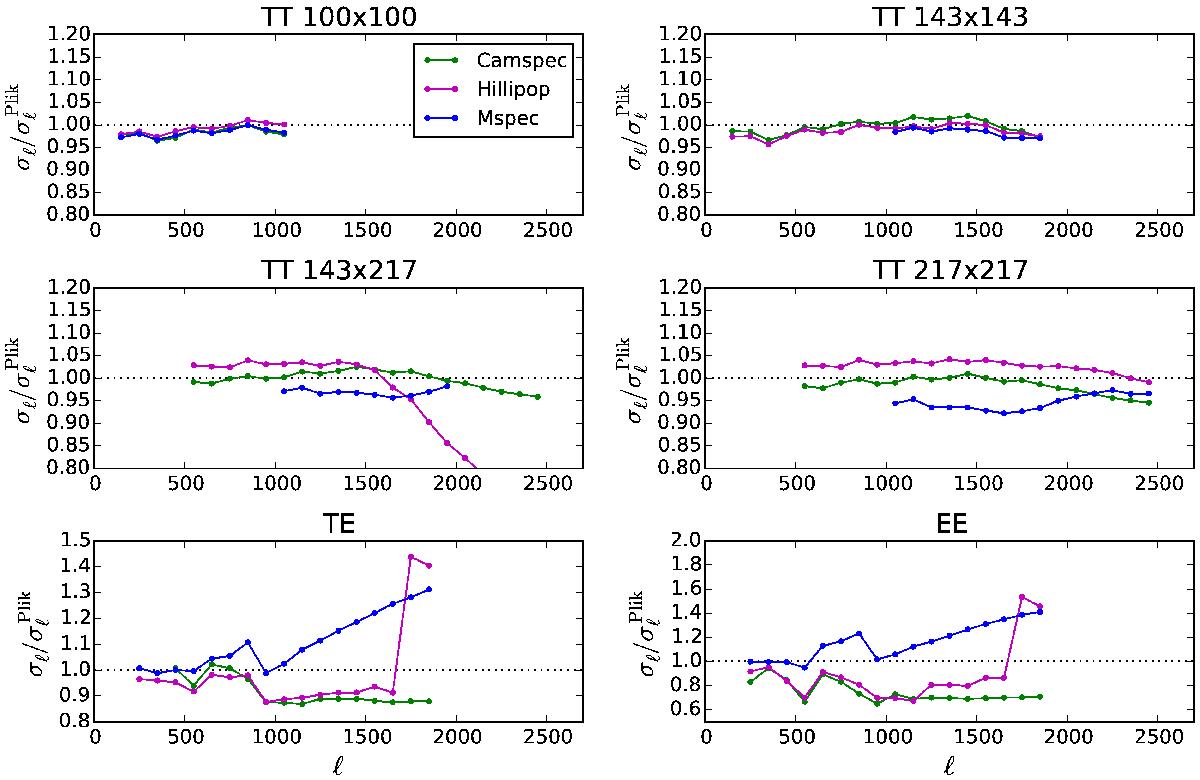
Comparison of error bars from the different high-ℓ likelihood codes. The quantities plotted are the ratios of each code’s error bars to those from Plik , and are for bins of width Δℓ = 100. Results are shown only in the ℓ range common to Plik and the code being compared.
Current usage metrics show cumulative count of Article Views (full-text article views including HTML views, PDF and ePub downloads, according to the available data) and Abstracts Views on Vision4Press platform.
Data correspond to usage on the plateform after 2015. The current usage metrics is available 48-96 hours after online publication and is updated daily on week days.
Initial download of the metrics may take a while.