Fig. 38
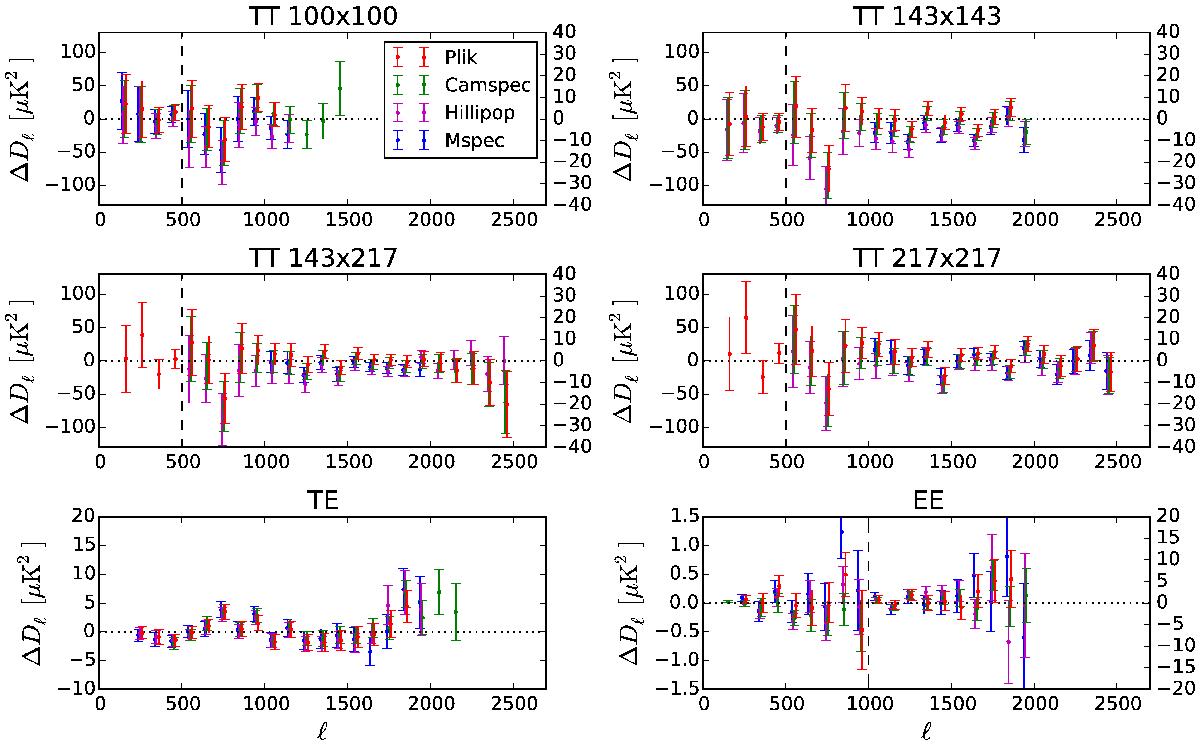
Comparison of power spectra residuals from different high-ℓ likelihood codes. The figure shows “data/calib − FG −Plik CMB”, where “data” stands for the empirical cross-frequency spectra, “FG” and “calib” are the best-fit foreground model and recalibration parameter for each individual code at that frequency, and the best-fit model Plik CMB is subtracted for visual presentation. These plots thus show the difference in the amount of power each code attributes to the CMB. The power spectra are binned in bins of width Δℓ = 100. The y-axis scale changes at ℓ = 500 for TT and ℓ = 1000 for EE (vertical dashes).
Current usage metrics show cumulative count of Article Views (full-text article views including HTML views, PDF and ePub downloads, according to the available data) and Abstracts Views on Vision4Press platform.
Data correspond to usage on the plateform after 2015. The current usage metrics is available 48-96 hours after online publication and is updated daily on week days.
Initial download of the metrics may take a while.