Fig. 33
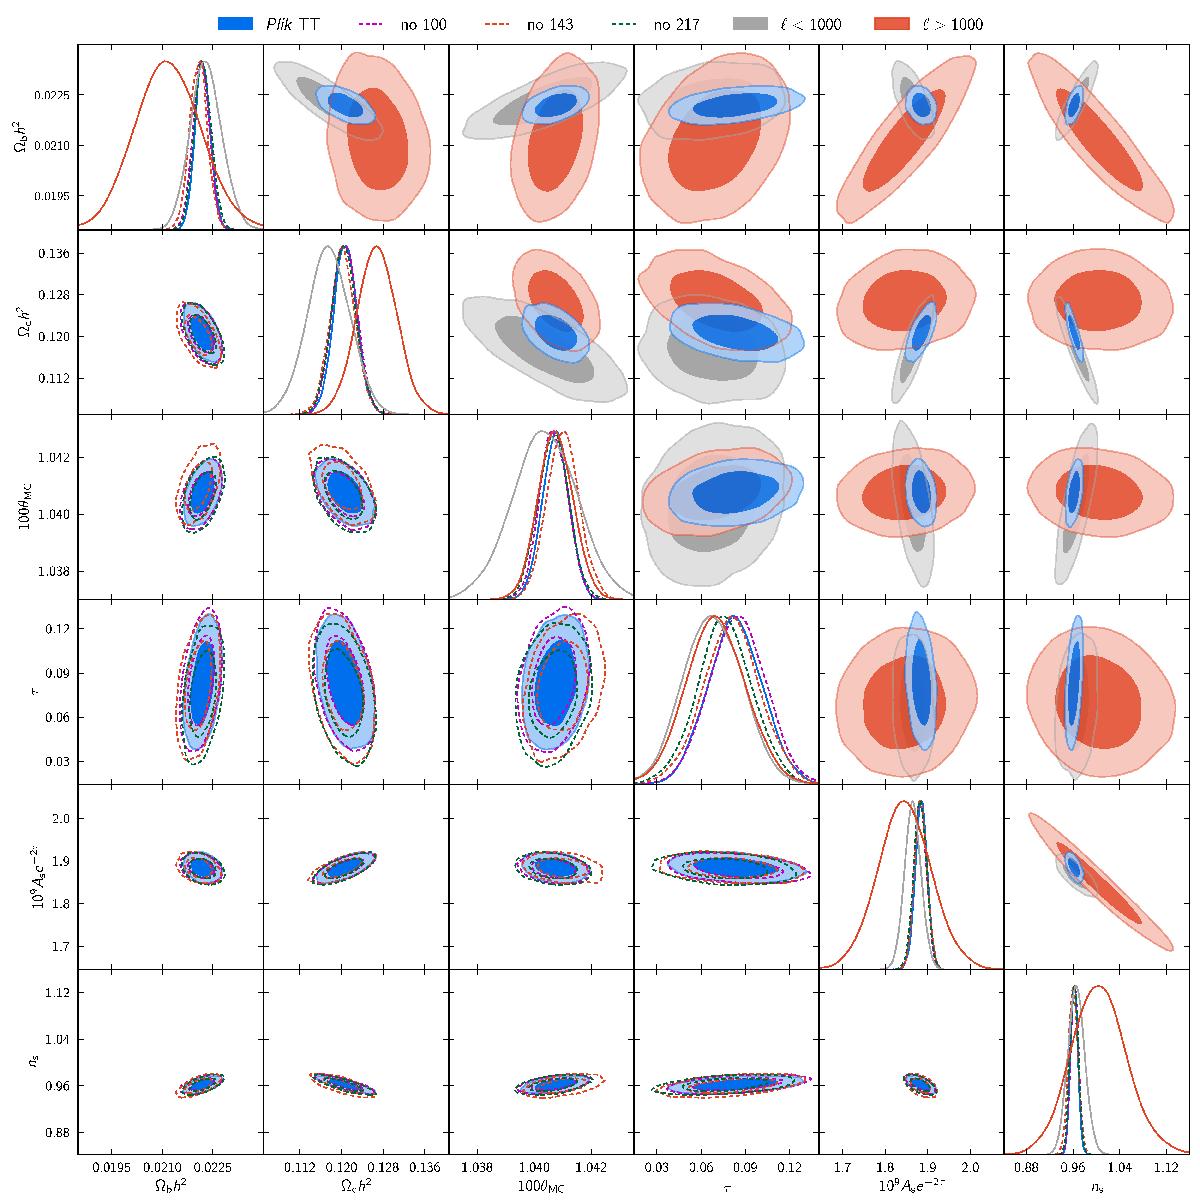
ΛCDM parameters posterior distribution for Plik TT+tauprior. The lower left triangle of the matrix displays how the constraints are modified when the information from one of the frequency channels is dropped. The upper right triangle displays how the constraints are modified when the information from multipoles ℓ greater or less than 1000 is dropped. All the results shown in this figure were obtained using the CAMB code.
Current usage metrics show cumulative count of Article Views (full-text article views including HTML views, PDF and ePub downloads, according to the available data) and Abstracts Views on Vision4Press platform.
Data correspond to usage on the plateform after 2015. The current usage metrics is available 48-96 hours after online publication and is updated daily on week days.
Initial download of the metrics may take a while.