Fig. 32
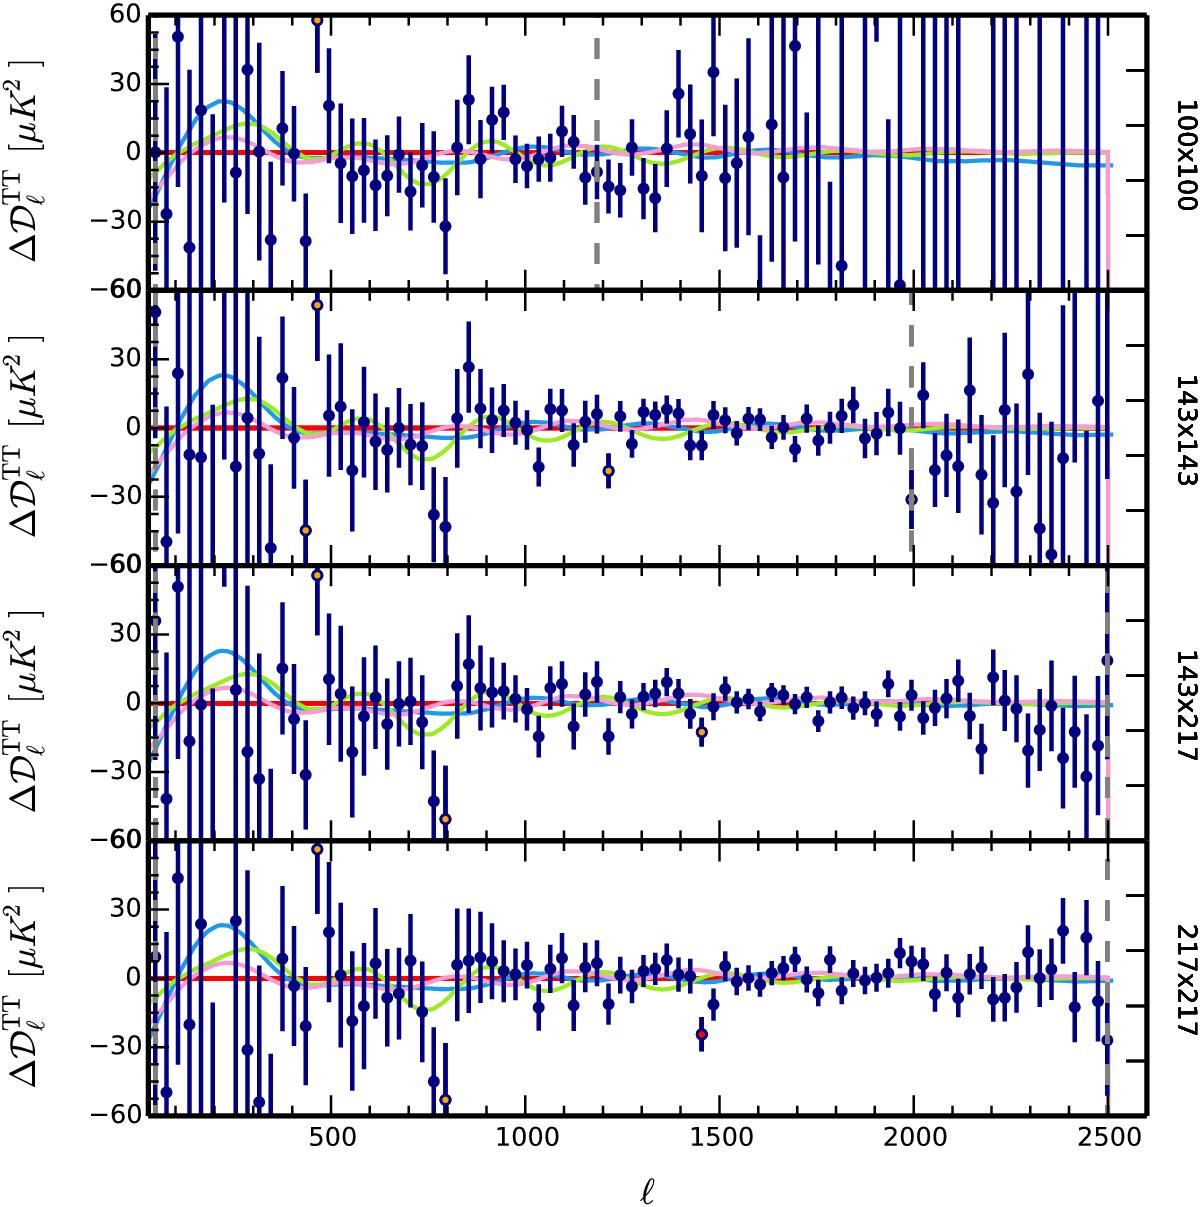
Residuals in the half-mission TT power spectra after subtracting the Plik TT+tauprior ΛCDM best-fit model (blue points, except for those which differ by at least 2 or 3σ, which are coloured in orange or red, respectively). The light blue line shows the difference between the best-fit model obtained assuming a ΛCDM+AL model and the ΛCDM best-fit baseline; the green line shows the difference of best-fit models using the ℓmax = 999 likelihood (fixing the foregrounds to the baseline solution) minus the baseline best-fit (both in the ΛCDM framework); while the pink line is the same as the green one but for ℓmax = 1404 instead of ℓmax = 999; see text in Sect. 4.1. For the TE and EE spectra, see Fig. 40.
Current usage metrics show cumulative count of Article Views (full-text article views including HTML views, PDF and ePub downloads, according to the available data) and Abstracts Views on Vision4Press platform.
Data correspond to usage on the plateform after 2015. The current usage metrics is available 48-96 hours after online publication and is updated daily on week days.
Initial download of the metrics may take a while.