Fig. 31
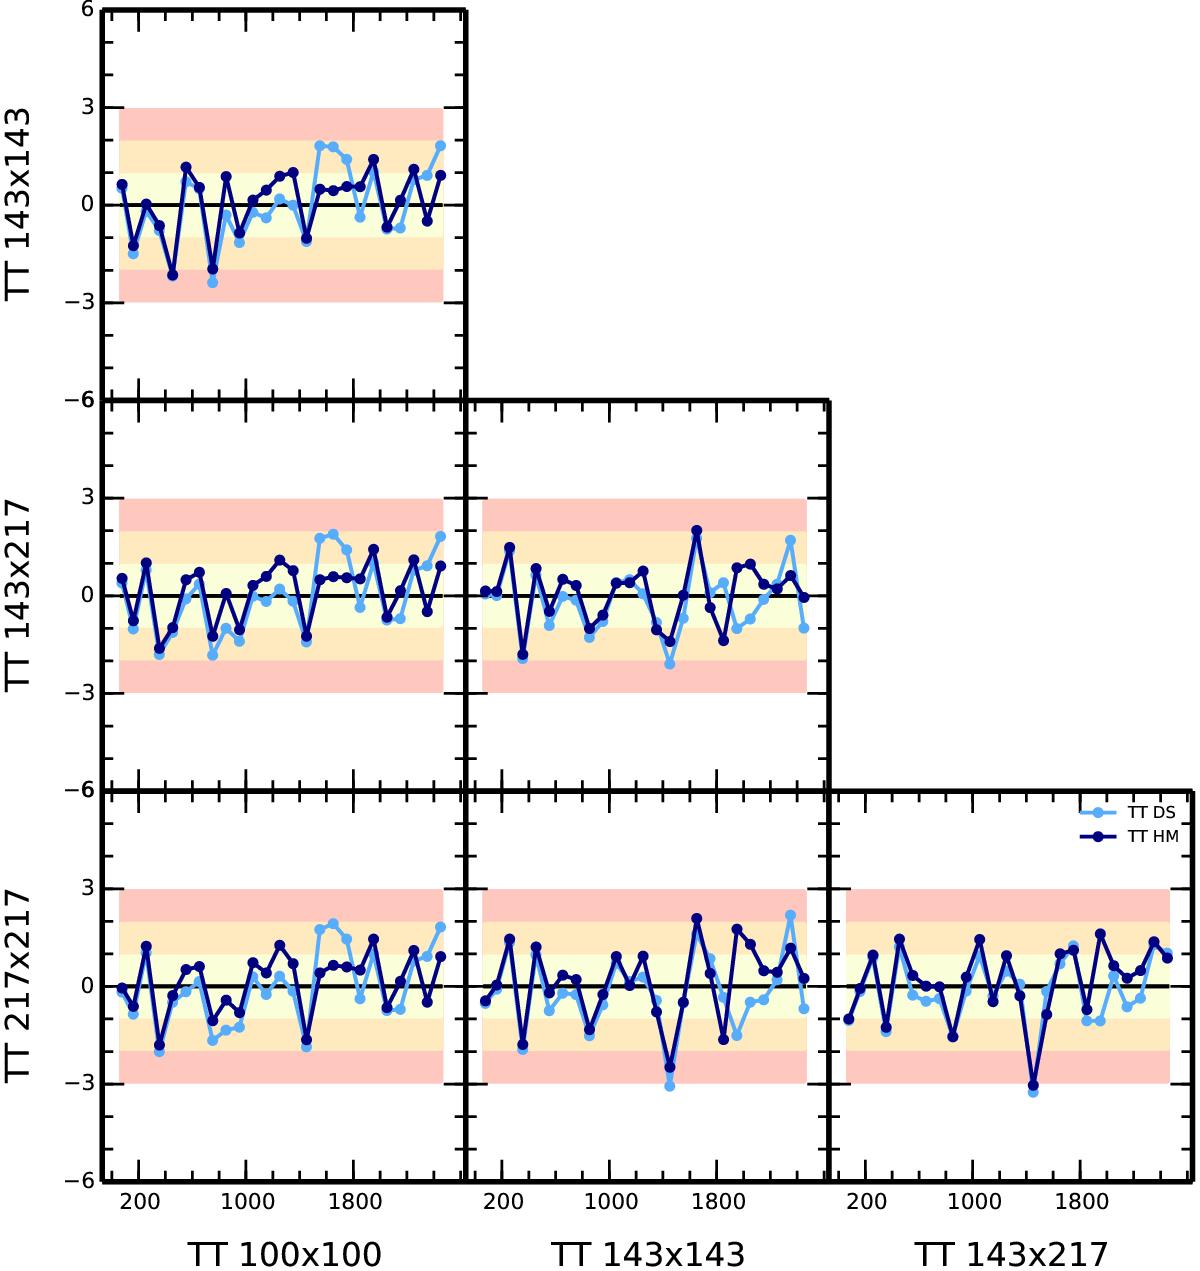
Inter-frequency foreground-cleaned TT power spectra differences, in μK2. Each of the sub-panels shows the difference, after foreground subtraction, between pairs of frequency power spectra (the spectrum named on the vertical axis minus the one named on the horizontal axis), in units of standard deviation. The coloured bands identify deviations that are smaller than one (yellow), two (orange), or three (red) standard deviations. We show the differences for both the HM power spectra (blue points) and the DS power spectra (light blue points) after correlated noise correction. Figure 41 displays the same quantities for the TE and EE spectra.
Current usage metrics show cumulative count of Article Views (full-text article views including HTML views, PDF and ePub downloads, according to the available data) and Abstracts Views on Vision4Press platform.
Data correspond to usage on the plateform after 2015. The current usage metrics is available 48-96 hours after online publication and is updated daily on week days.
Initial download of the metrics may take a while.