Fig. 28
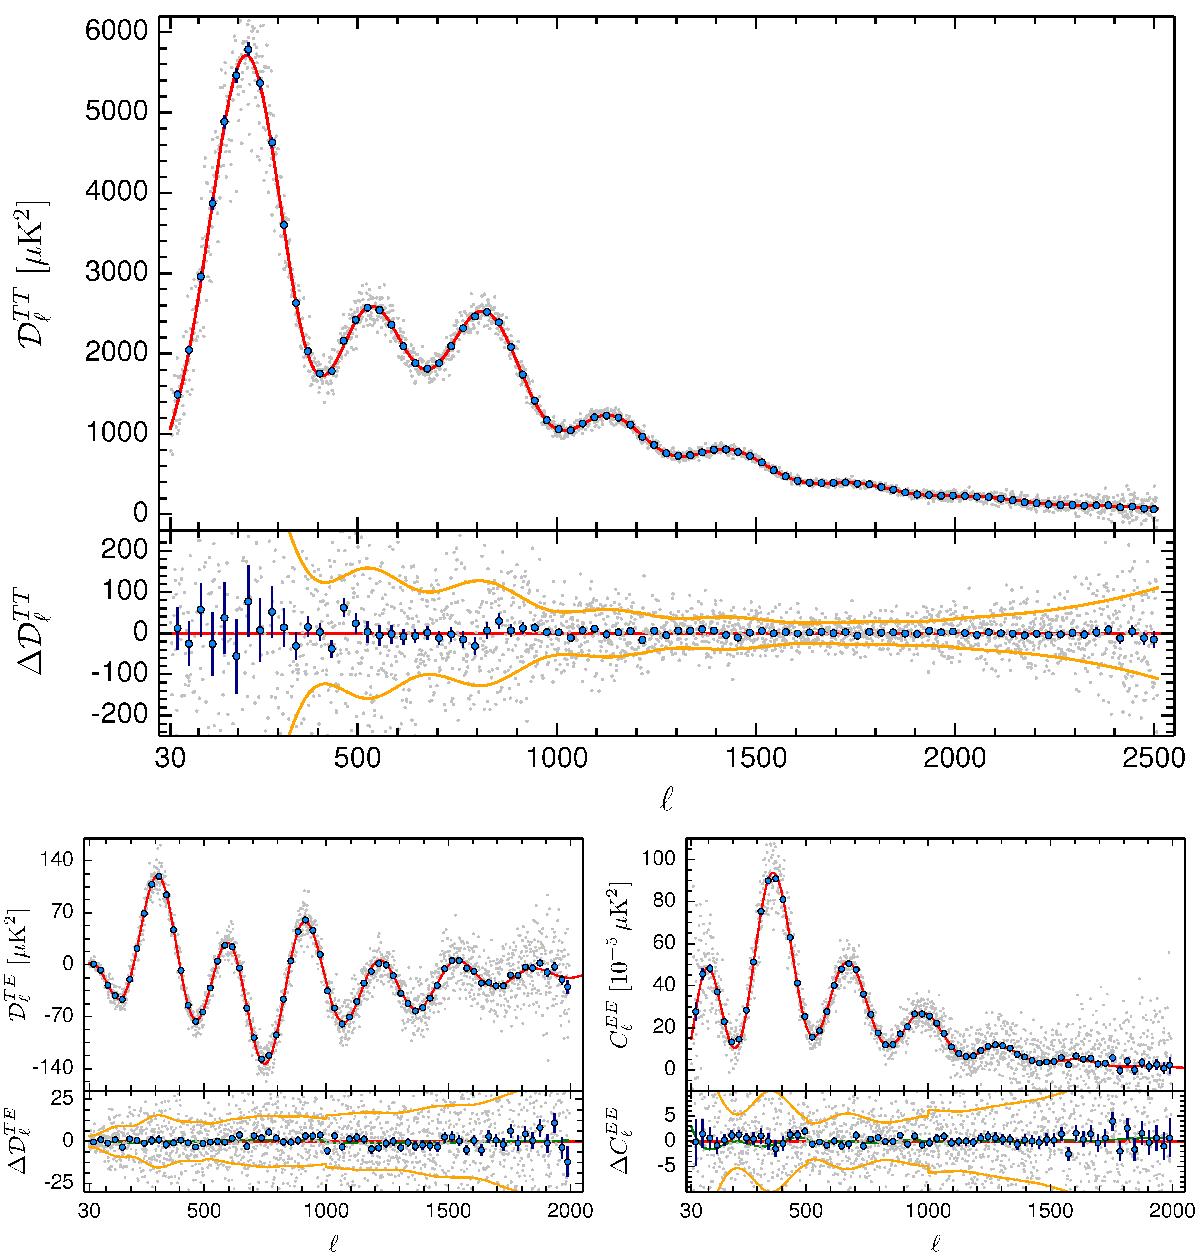
Plik 2015 co-added TT, TE, and EE spectra. The blue points are for bins of Δℓ = 30, while the grey points are unbinned. The lower panels show the residuals with respect to the best fit Plik TT+tauprior ΛCDM model. The yellow lines show the 68% unbinned error bars. For TE and EE, we also show the best-fit beam-leakage correction (green line; see text and Fig. 23).
Current usage metrics show cumulative count of Article Views (full-text article views including HTML views, PDF and ePub downloads, according to the available data) and Abstracts Views on Vision4Press platform.
Data correspond to usage on the plateform after 2015. The current usage metrics is available 48-96 hours after online publication and is updated daily on week days.
Initial download of the metrics may take a while.