Fig. 26
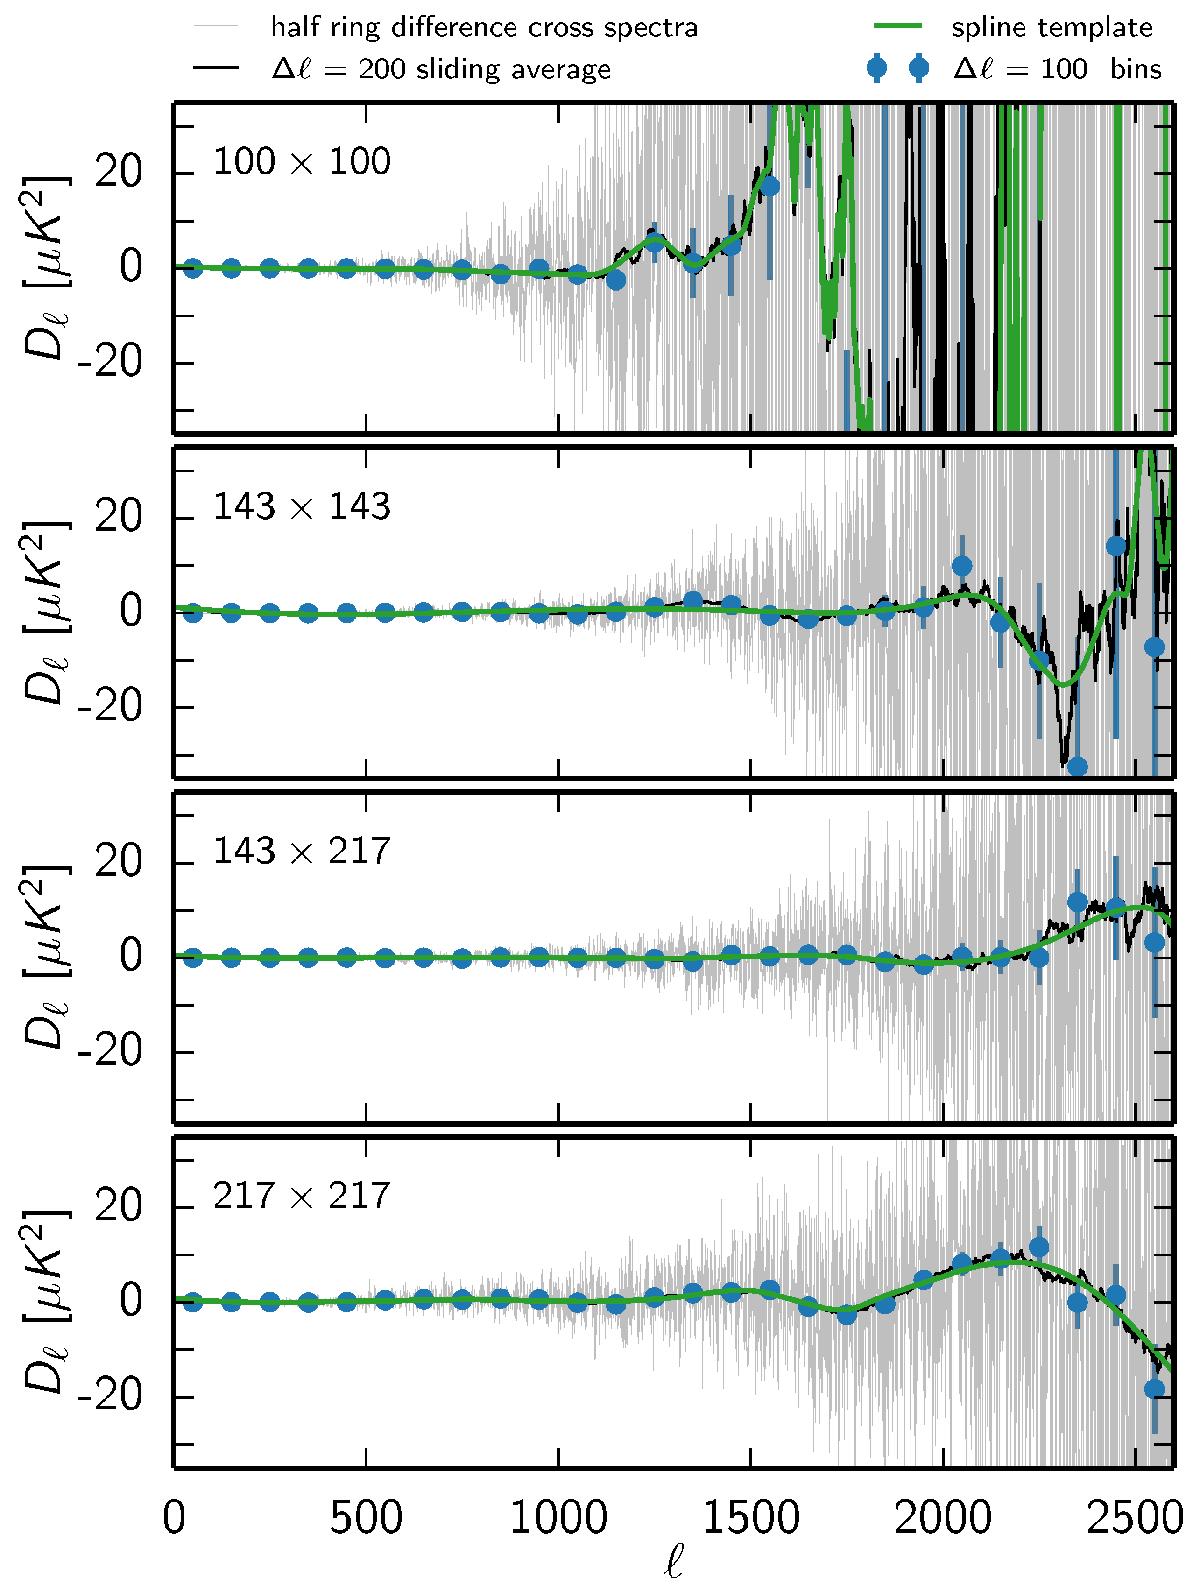
Correlated noise model. In grey are shown the cross-detector TT spectra of the half-ring difference maps. The black line show the same, smoothed by a Δℓ = 200 sliding average, while the blue data points are a Δℓ = 100 binned version of the grey line. Error bars simply reflect the scatter in each bin. The green line is the spline-smoothed version of the data that we use as our correlated noise template.
Current usage metrics show cumulative count of Article Views (full-text article views including HTML views, PDF and ePub downloads, according to the available data) and Abstracts Views on Vision4Press platform.
Data correspond to usage on the plateform after 2015. The current usage metrics is available 48-96 hours after online publication and is updated daily on week days.
Initial download of the metrics may take a while.