Fig. 25
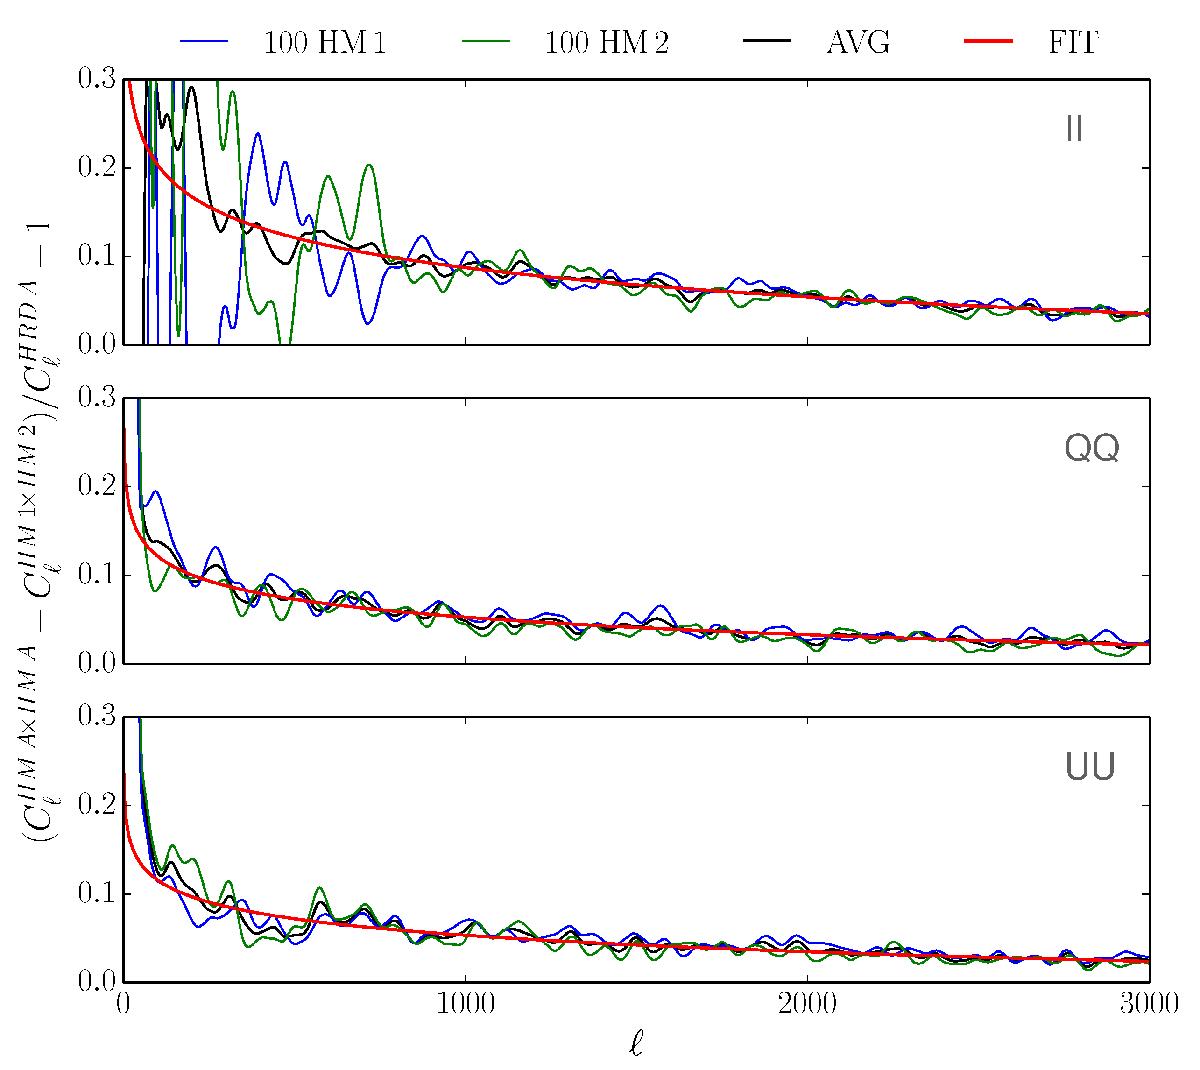
Difference between auto and cross-spectra for the 100 GHz half-mission maps, divided by the noise estimate from half-ring difference maps (blue and green lines). Noise estimates derived from half-ring difference maps are biased low. We fit the average of both half-mission curves (black line) with a power law model (red line). The analysis procedure is applied to the Stokes parameter maps I, Q, and U (top to bottom). All data power spectra are smoothed.
Current usage metrics show cumulative count of Article Views (full-text article views including HTML views, PDF and ePub downloads, according to the available data) and Abstracts Views on Vision4Press platform.
Data correspond to usage on the plateform after 2015. The current usage metrics is available 48-96 hours after online publication and is updated daily on week days.
Initial download of the metrics may take a while.