Free Access
Fig. 24
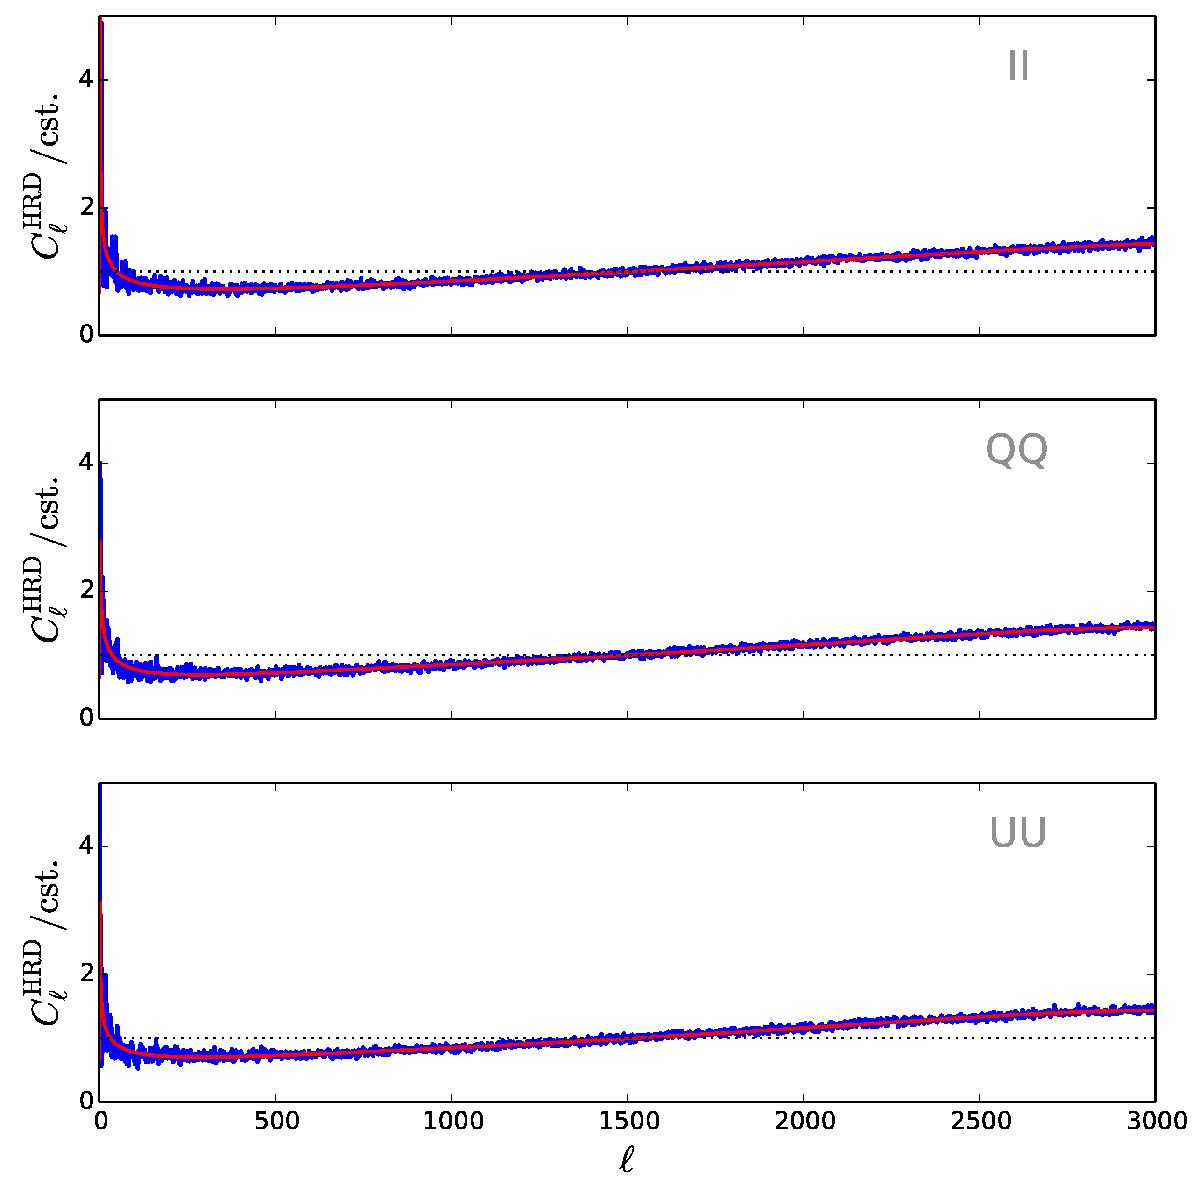
Deviations from a white noise power spectrum induced by noise correlations. We show half-ring difference power spectra for 100 GHz half-mission 1 maps (blue lines) of Stokes parameters I (top panel), Q (middle panel), and U (bottom panel). The best-fitting analytical model of the form Eq. (48) is over-plotted in red.
Current usage metrics show cumulative count of Article Views (full-text article views including HTML views, PDF and ePub downloads, according to the available data) and Abstracts Views on Vision4Press platform.
Data correspond to usage on the plateform after 2015. The current usage metrics is available 48-96 hours after online publication and is updated daily on week days.
Initial download of the metrics may take a while.