Fig. 23
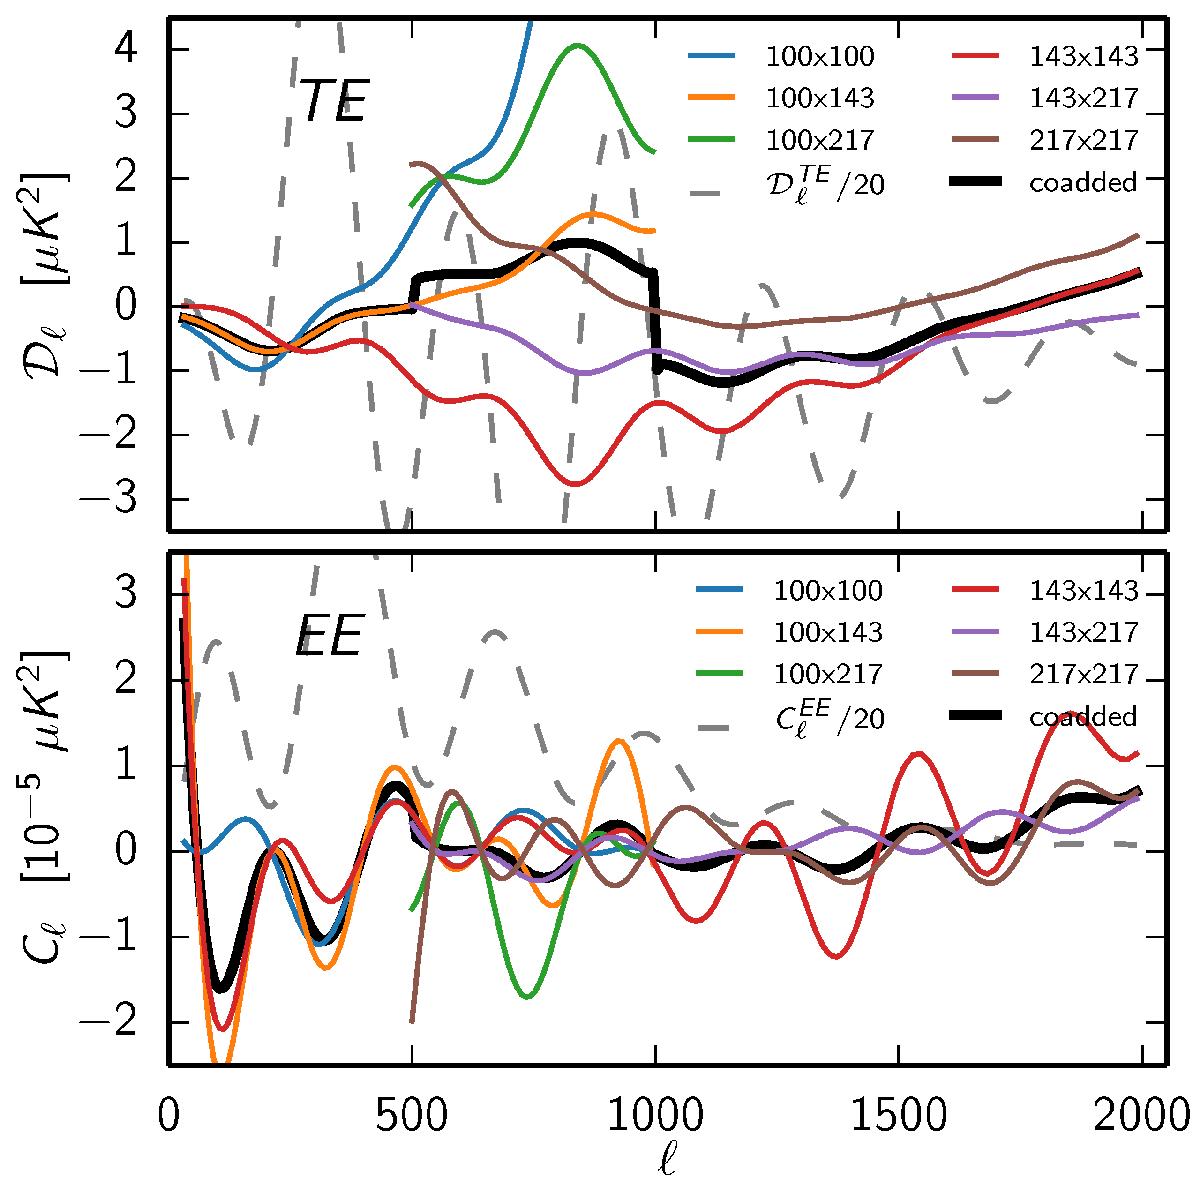
Best fit of the power spectrum leakage due to the beam mismatch for TE (Eq. (45a), upper panel) and EE (Eq. (45b), lower panel). In each case, we show the correction for individual cross-spectra (coloured thin lines) and the co-added correction (black line). The individual cross-spectra corrections are only shown in the range of multipoles where the data from each particular pair is used. The individual correction can be much higher than the co-added correction. The co-added correction is dominated by the best S/N pair for each multipole. For example, up to ℓ = 500, the TE co-added correction is dominated by the 100 × 143 contribution. The grey dashed lines show the TE and EE best-fit spectra rescaled by a factor of 20, to give an idea of the location of the model peaks.
Current usage metrics show cumulative count of Article Views (full-text article views including HTML views, PDF and ePub downloads, according to the available data) and Abstracts Views on Vision4Press platform.
Data correspond to usage on the plateform after 2015. The current usage metrics is available 48-96 hours after online publication and is updated daily on week days.
Initial download of the metrics may take a while.