Fig. 21
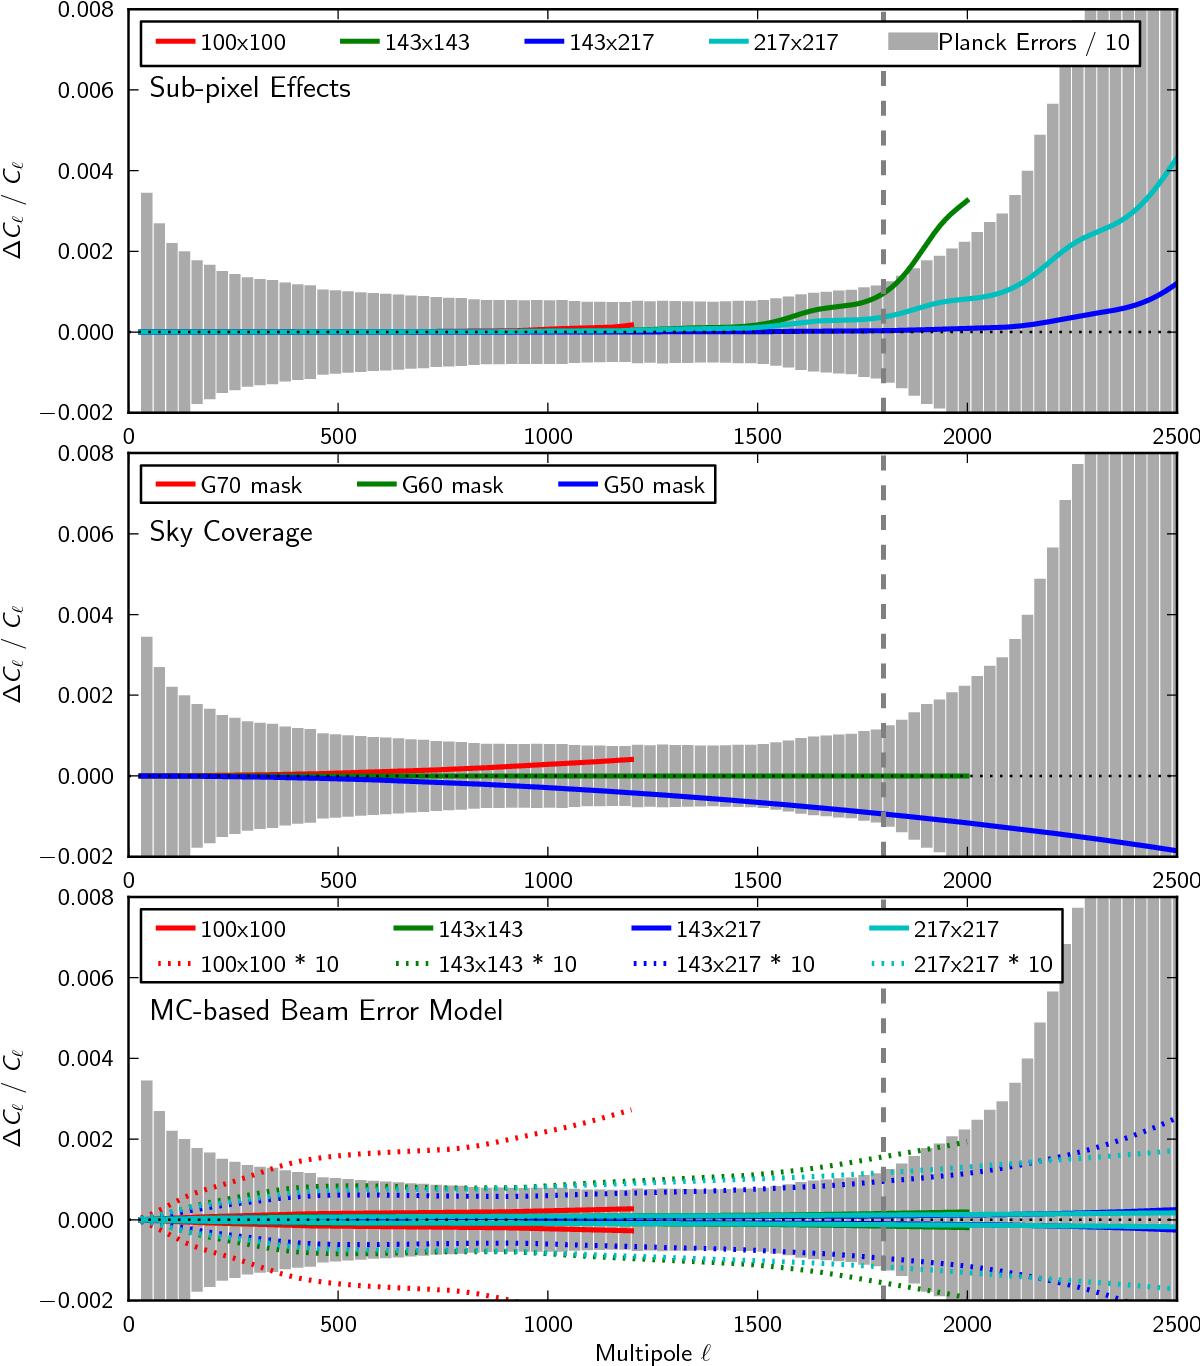
Contribution of various beam-window-function-related errors and uncertainties to the Cℓ relative error. In each panel, the grey histogram shows the relative statistical error on the Planck CMB TT binned power spectrum (for a bin width Δℓ = 30) divided by 10, while the vertical grey dashes delineate the range ℓ< 1800 that is most informative for base ΛCDM. Top: estimation of the error made by ignoring the sub-pixel effects for a fiducial Cℓ including the CMB and CIB contributions. Middle: error due to the sky mask, for the Galactic masks used in the TT analysis. Bottom: current beam window function error model, shown at 1σ (solid lines) and 10σ (dotted lines).
Current usage metrics show cumulative count of Article Views (full-text article views including HTML views, PDF and ePub downloads, according to the available data) and Abstracts Views on Vision4Press platform.
Data correspond to usage on the plateform after 2015. The current usage metrics is available 48-96 hours after online publication and is updated daily on week days.
Initial download of the metrics may take a while.