Fig. 2
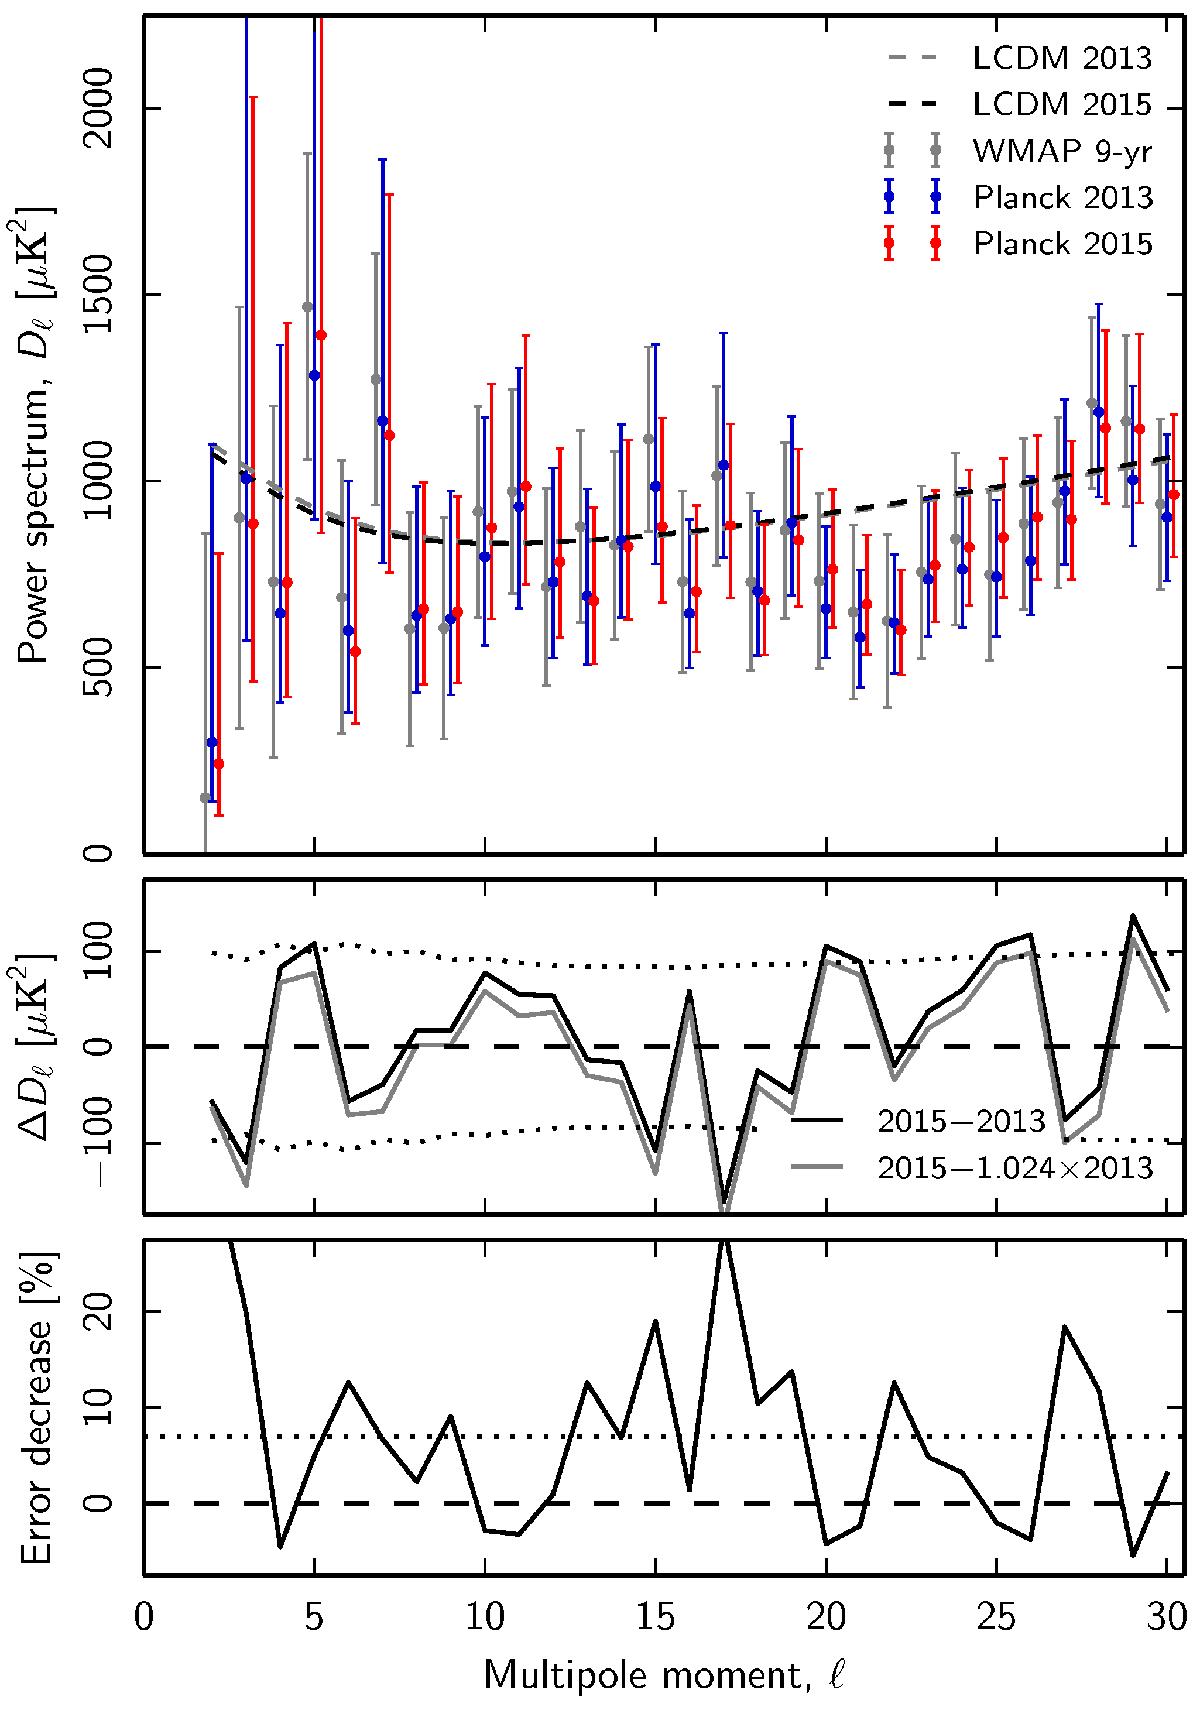
Top: comparison of the Planck 2013 (blue points) and 2015 (red points) posterior-maximum low-ℓ temperature power spectra, as derived with Commander . Error bars indicate asymmetric marginal posterior 68% confidence regions. For reference, we also show the final 9-year WMAP temperature spectrum in light gray points, as presented by Bennett et al. (2013); note that the error bars indicate symmetric Fisher uncertainties in this case. The dashed lines show the best-fit ΛCDM spectra derived from the respective data sets, including high-multipole and polarization information. Middle: difference between the 2015 and 2013 maximum-posterior power spectra (solid black line). The gray shows the same difference after scaling the 2013 spectrum up by 2.4%. Dotted lines indicate the expected ± 1σ confidence region, accounting only for the sky fraction difference. Bottom: reduction in marginal error bars between the 2013 and 2015 temperature spectra; see main text for explicit definition. The dotted line shows the reduction expected from increased sky fraction alone.
Current usage metrics show cumulative count of Article Views (full-text article views including HTML views, PDF and ePub downloads, according to the available data) and Abstracts Views on Vision4Press platform.
Data correspond to usage on the plateform after 2015. The current usage metrics is available 48-96 hours after online publication and is updated daily on week days.
Initial download of the metrics may take a while.