Free Access
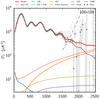
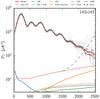
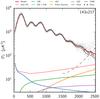
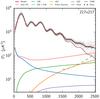
Fig. 18
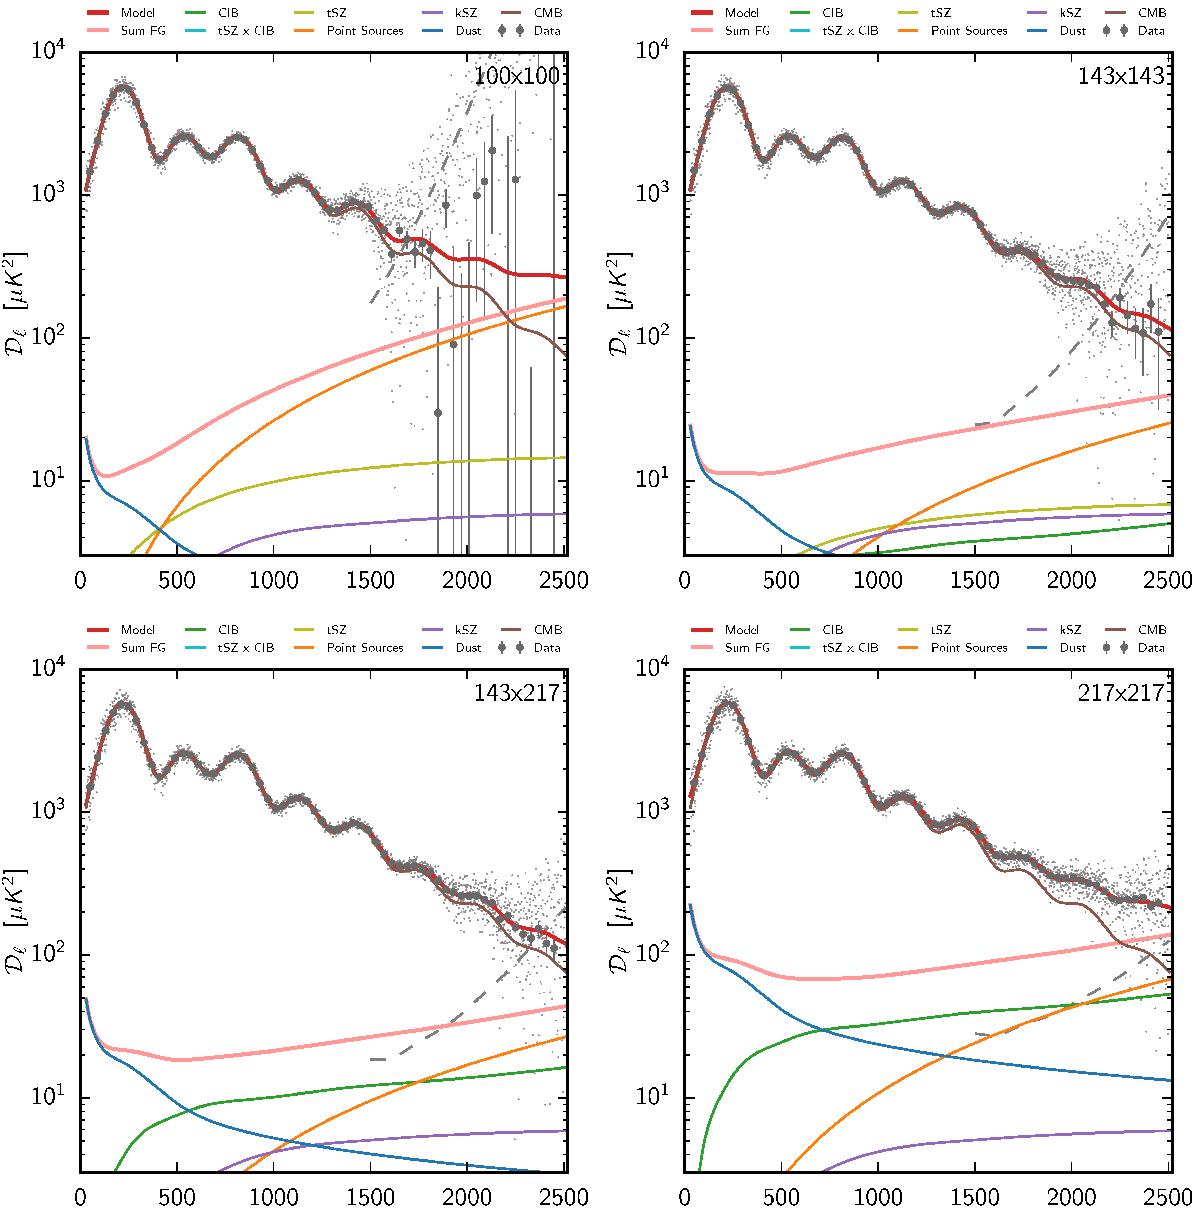
Best model (CMB and foreground) in each of the cross-spectra used for the temperature high-ℓ likelihood. The small light grey points show the unbinned data point, and the dashed grey line show the square root of the noise contribution to the diagonal of the unbinned covariance matrix.
This figure is made of several images, please see below:
Current usage metrics show cumulative count of Article Views (full-text article views including HTML views, PDF and ePub downloads, according to the available data) and Abstracts Views on Vision4Press platform.
Data correspond to usage on the plateform after 2015. The current usage metrics is available 48-96 hours after online publication and is updated daily on week days.
Initial download of the metrics may take a while.