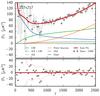
Fig. 17
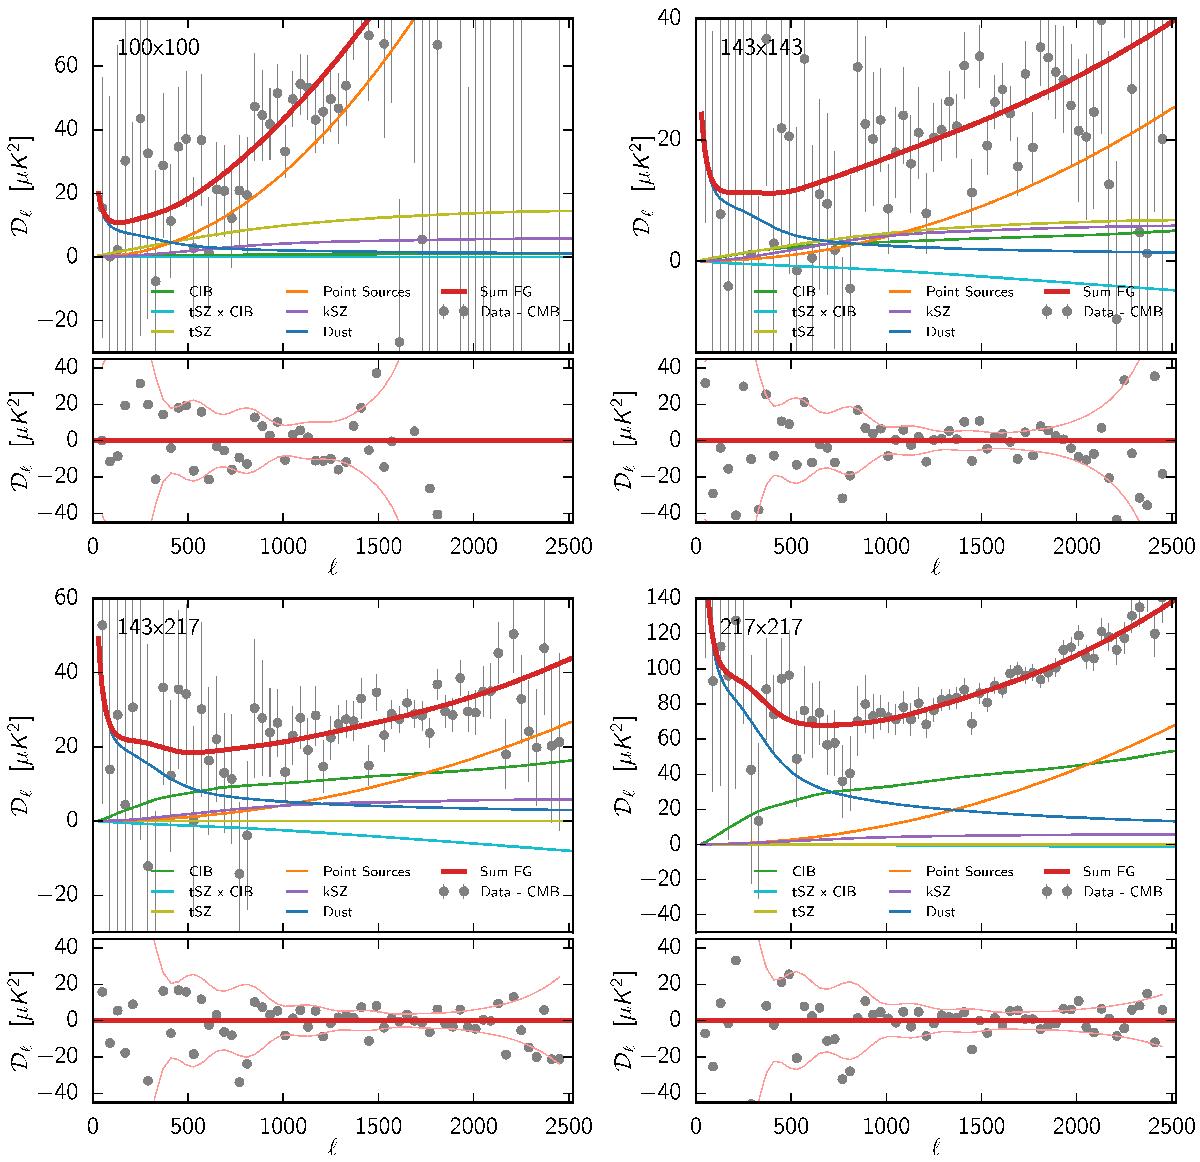
Best foreground model in each of the cross-spectra used for the temperature high-ℓ likelihood. The data corrected by the best theoretical CMB Cℓ are shown in grey. The bottom panel of each plot shows the residual after foreground correction. The pink line shows the 1σ value from the diagonal of the covariance matrix (32% of the unbinned points are out of this range).
Current usage metrics show cumulative count of Article Views (full-text article views including HTML views, PDF and ePub downloads, according to the available data) and Abstracts Views on Vision4Press platform.
Data correspond to usage on the plateform after 2015. The current usage metrics is available 48-96 hours after online publication and is updated daily on week days.
Initial download of the metrics may take a while.