Fig. 15
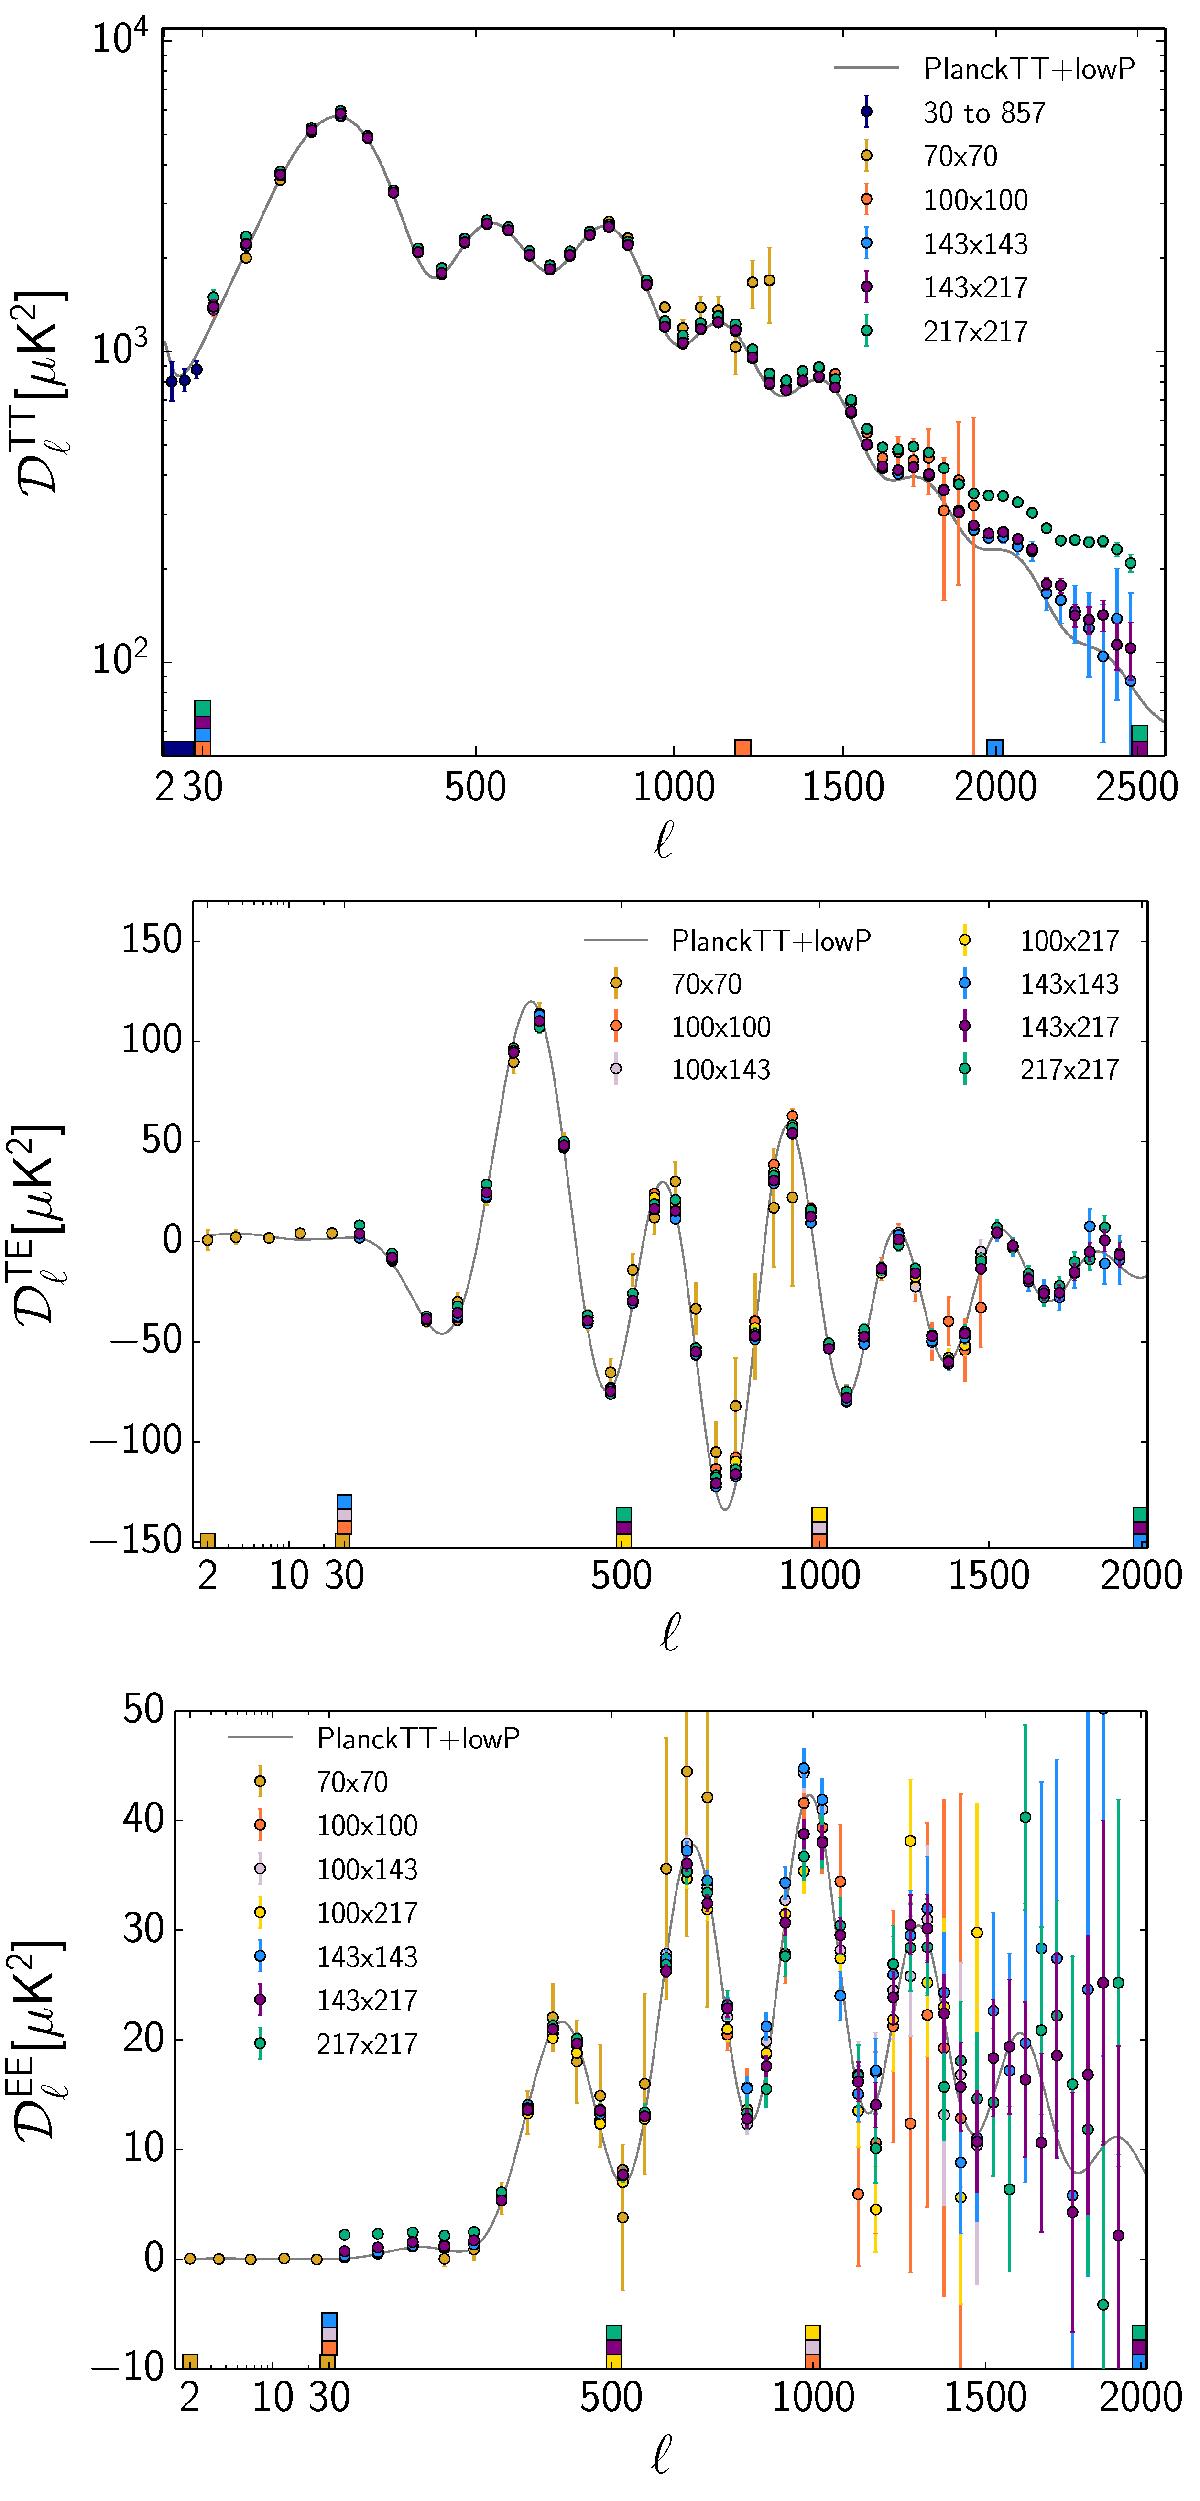
Planck power spectra (not yet corrected for foregrounds) and data selection. The coloured tick marks indicate the ℓ-range of the cross-spectra included in the Planck likelihood. Although not used in the high-ℓ likelihood, the 70 GHz spectra at ℓ> 29 illustrate the consistency of the data. The grey line indicates the best-fit Planck 2015 spectrum. The TE and EE plots have a logarithmic horizontal scale for ℓ< 30.
Current usage metrics show cumulative count of Article Views (full-text article views including HTML views, PDF and ePub downloads, according to the available data) and Abstracts Views on Vision4Press platform.
Data correspond to usage on the plateform after 2015. The current usage metrics is available 48-96 hours after online publication and is updated daily on week days.
Initial download of the metrics may take a while.