Fig. 1
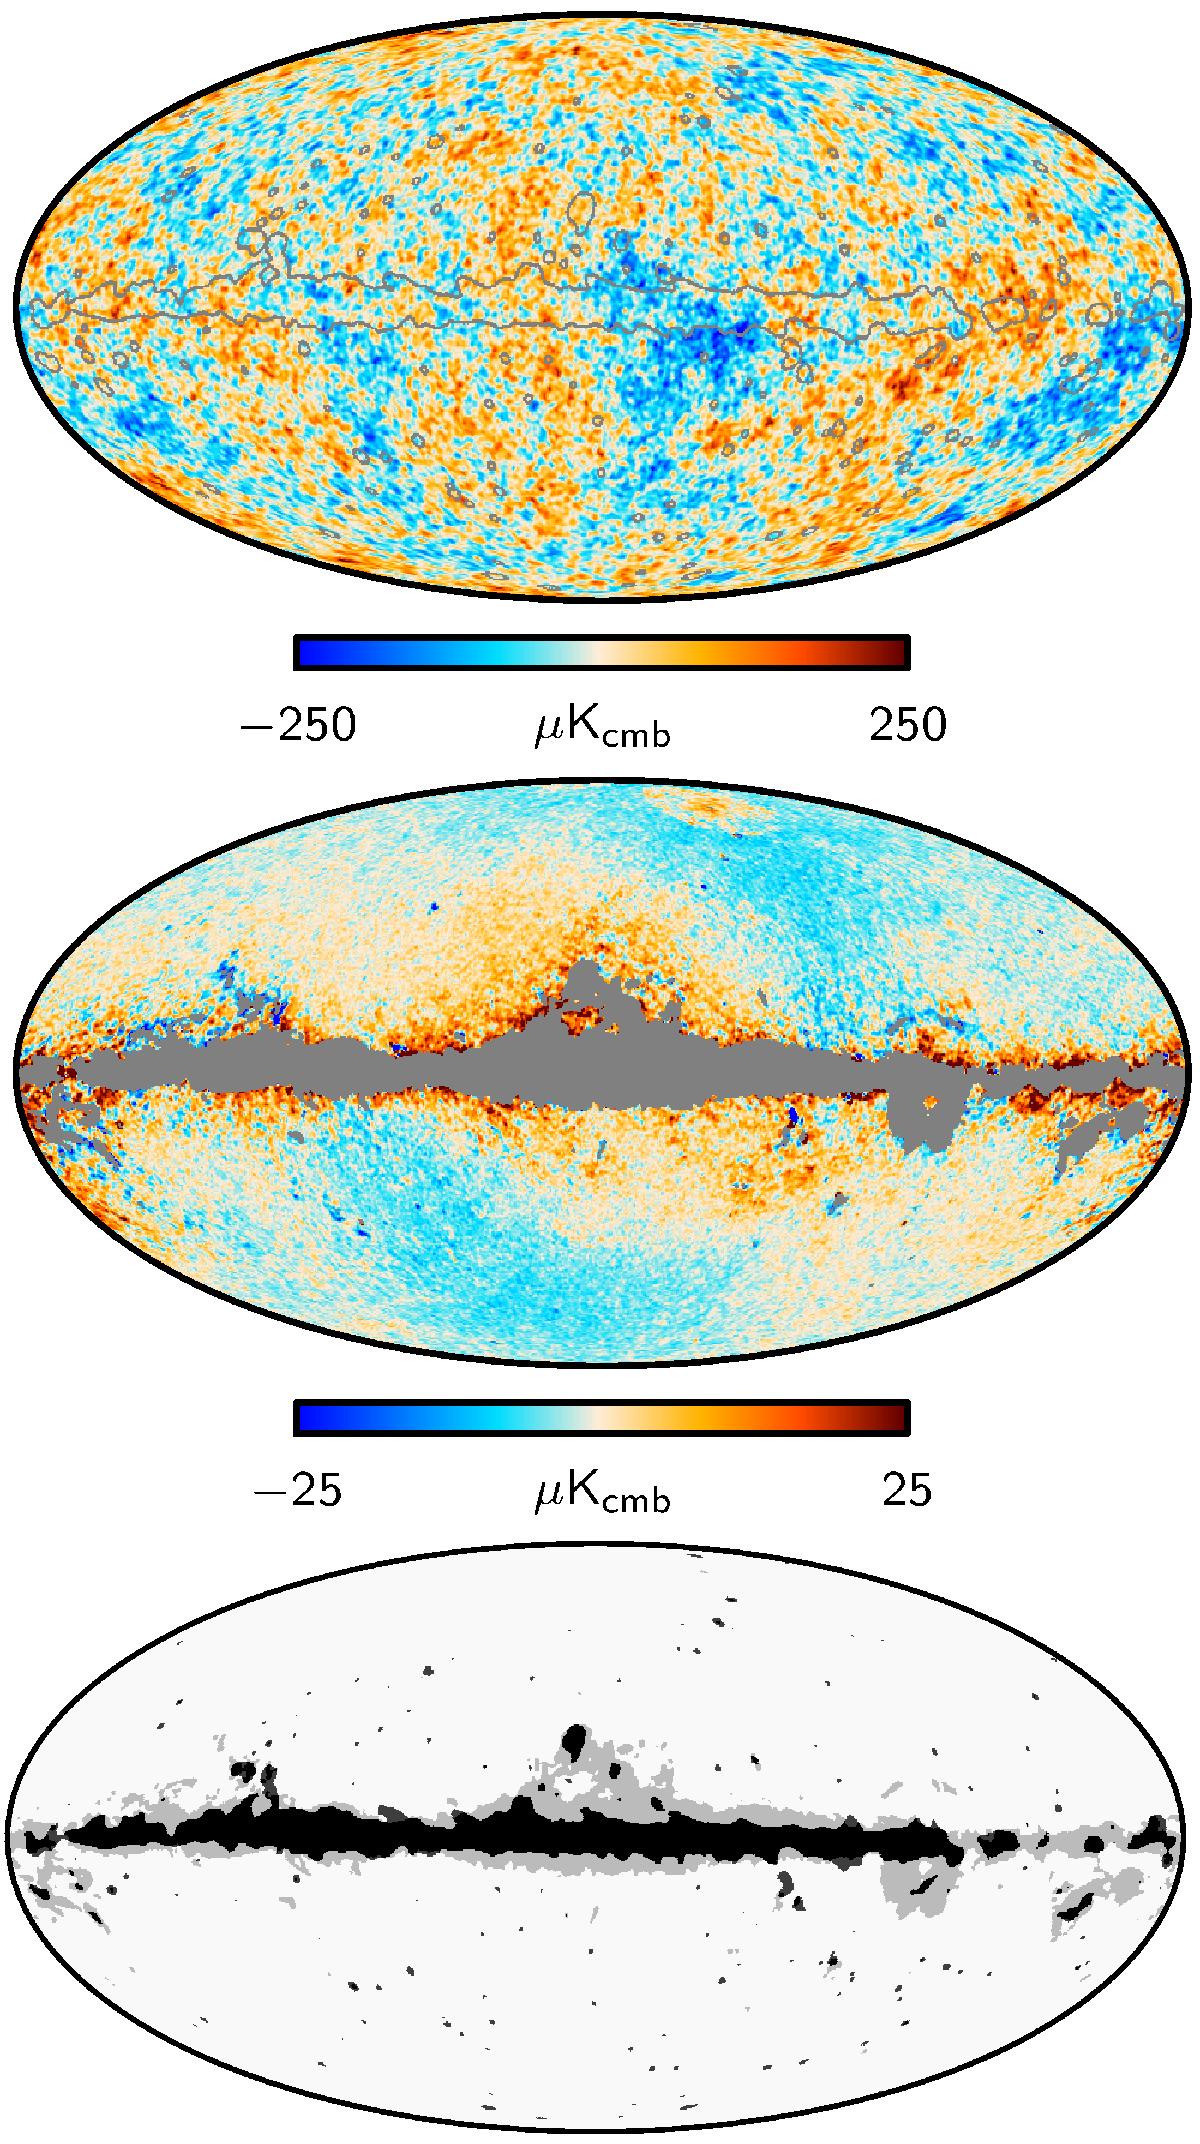
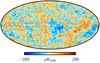
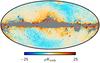
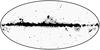
Top: Commander CMB temperature map derived from the Planck 2015, 9-year WMAP, and 408 MHz Haslam et al. observations, as described in Planck Collaboration X (2016). The gray boundary indicates the 2015 likelihood temperature mask, covering a total of 7% of the sky. The masked area has been filled with a constrained Gaussian realization. Middle: difference between the 2015 and 2013 Commander temperature maps. The masked region indicates the 2013 likelihood mask, removing 13% of the sky. Bottom: comparison of the 2013 (gray) and 2015 (black) temperature likelihood masks.
Current usage metrics show cumulative count of Article Views (full-text article views including HTML views, PDF and ePub downloads, according to the available data) and Abstracts Views on Vision4Press platform.
Data correspond to usage on the plateform after 2015. The current usage metrics is available 48-96 hours after online publication and is updated daily on week days.
Initial download of the metrics may take a while.