Fig. 21
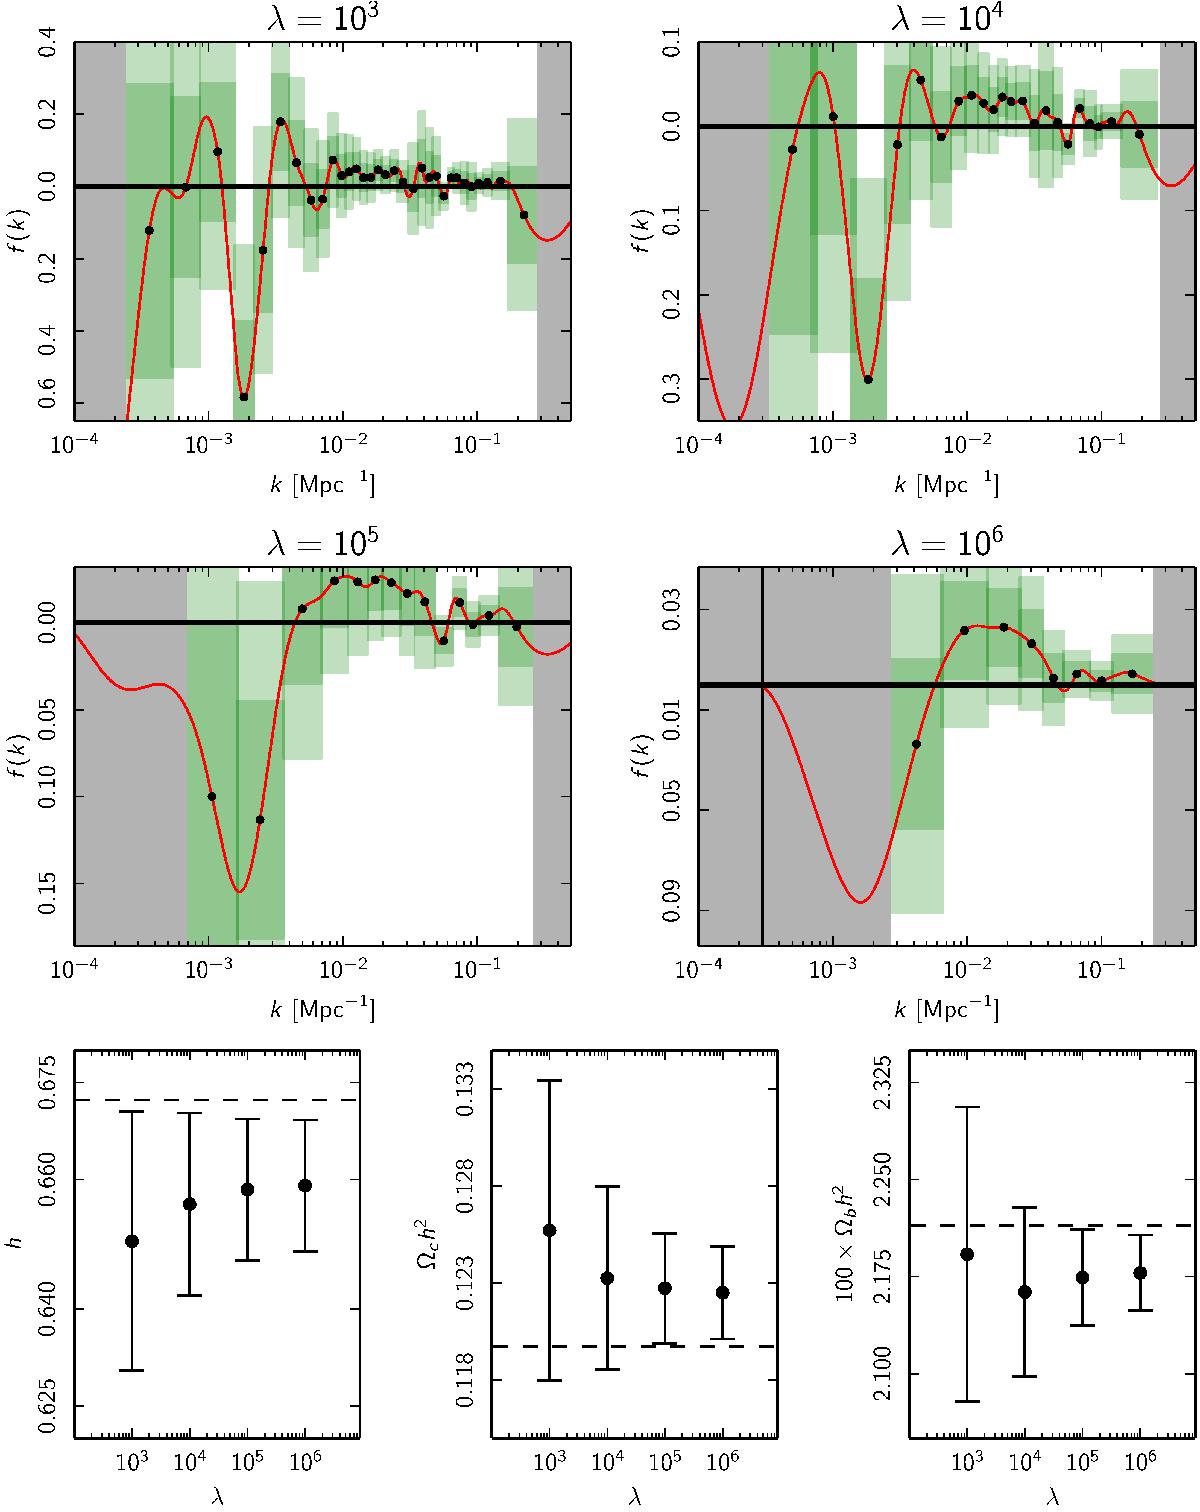
Planck TT+lowP likelihood primordial power spectrum (PPS) reconstruction results. Top four panels: reconstruction of the deviation f(k) using four different roughness penalties. The red curves represent the best-fit deviation f(k) using the Planck TT+lowP likelihood. f(k) = 0 would represent a perfectly featureless spectrum with respect to the fiducial PPS model, which is obtained from the best-fit base ΛCDM model with a power-law PPS. The vertical extent of the dark and light green error bars indicates the ± 1σ and ± 2σ errors, respectively. The width of the error bars represents the minimum reconstructible width (the minimum width for a Gaussian feature so that the mean square deviation of the reconstruction is less than 10%). The grey regions indicate where the minimum reconstructible width is undefined, indicating that the reconstruction in these regions is untrustworthy. The hatched region in the λ = 106 plot shows where the fixing penalty has been applied. These hashed regions are not visible in the other three reconstructions, for which κmin lies outside the range shown in the plots. For all values of the roughness penalty, all data points are within 2σ of the fiducial PPS except for the deviations around k ≈ 0.002 Mpc-1 in the λ = 103 and λ = 104 reconstructions. Lower three panels: ± 1σ error bars of the three non-PPS cosmological parameters included in the maximum likelihood reconstruction. All values are consistent with their respective best-fit fiducial model values indicated by the dashed lines.
Current usage metrics show cumulative count of Article Views (full-text article views including HTML views, PDF and ePub downloads, according to the available data) and Abstracts Views on Vision4Press platform.
Data correspond to usage on the plateform after 2015. The current usage metrics is available 48-96 hours after online publication and is updated daily on week days.
Initial download of the metrics may take a while.