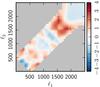
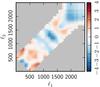
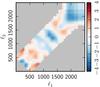
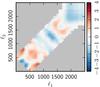
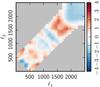
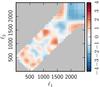
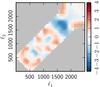
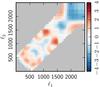
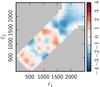
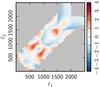
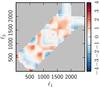
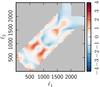
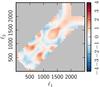
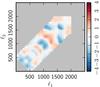
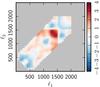
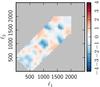
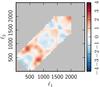
Fig. 8
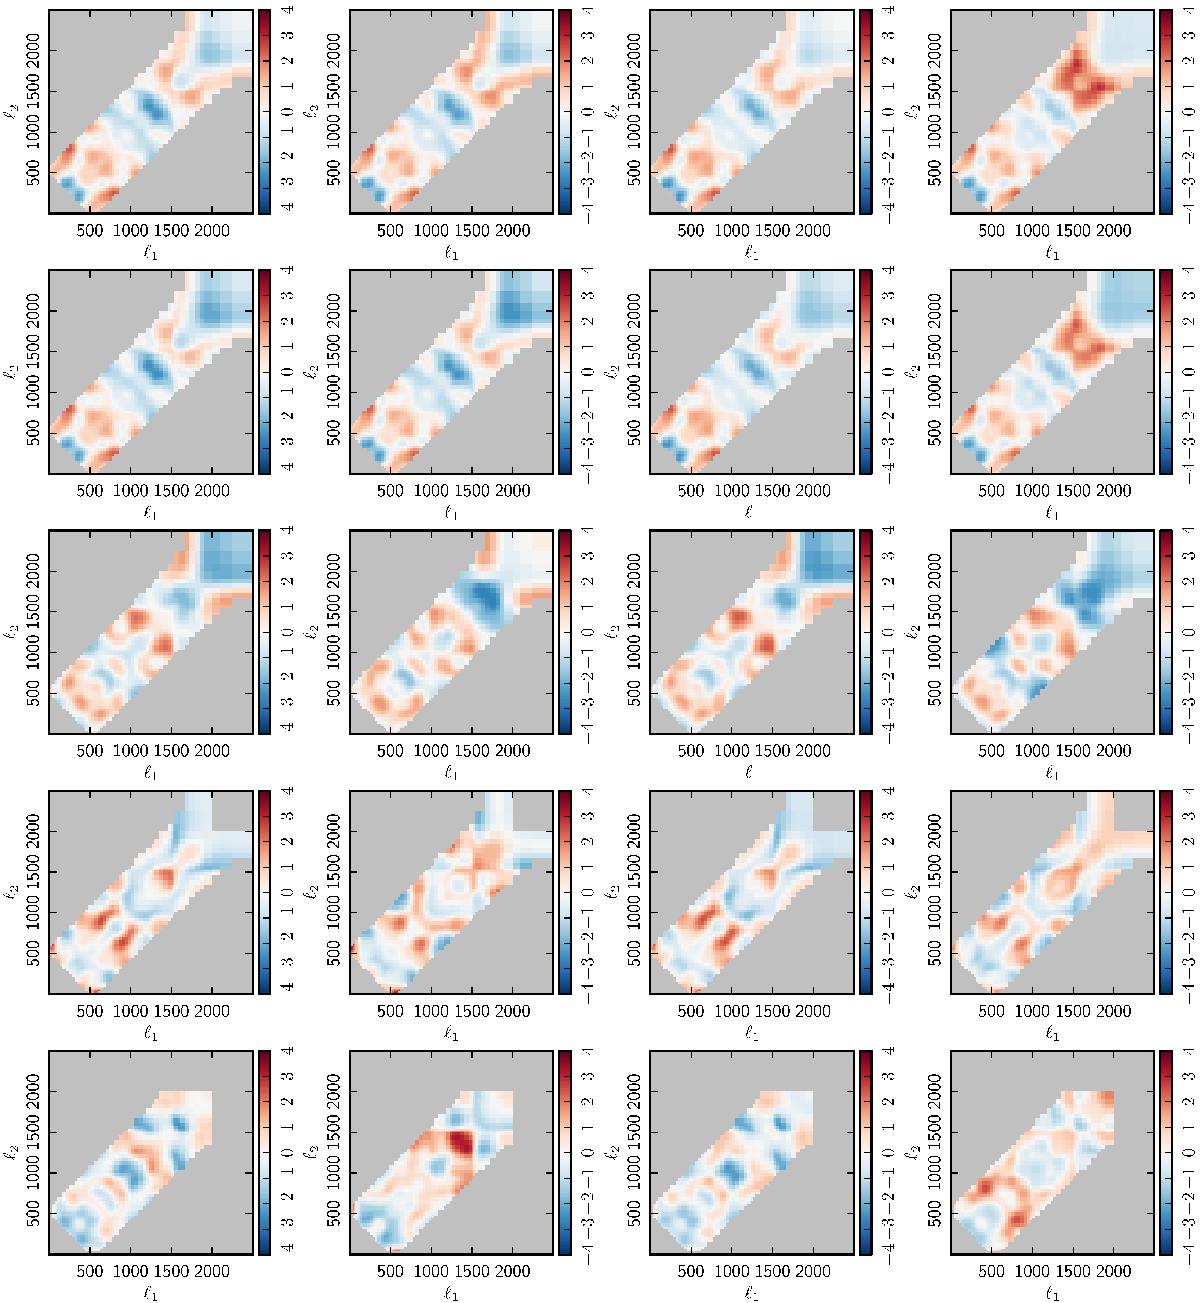
Smoothed binned signal-to-noise bispectrum ℬ for the Planck 2015 cleaned sky map, as determined with the binned estimator, as a function of ℓ1 and ℓ2 for a fixed ℓ3-bin [518, 548]. From left to right results are shown for the four component separation methods SMICA, SEVEM, NILC, and Commander. From top to bottom are shown: TTT, TTT cleaned from radio and CIB point sources; T2E, TE2; and EEE. The colour range is in signal-to-noise from − 4 to + 4. The light grey regions are where the bispectrum is not defined, either because it is outside the triangle inequality or because of the cut ![]() .
.
Current usage metrics show cumulative count of Article Views (full-text article views including HTML views, PDF and ePub downloads, according to the available data) and Abstracts Views on Vision4Press platform.
Data correspond to usage on the plateform after 2015. The current usage metrics is available 48-96 hours after online publication and is updated daily on week days.
Initial download of the metrics may take a while.