Fig. 5
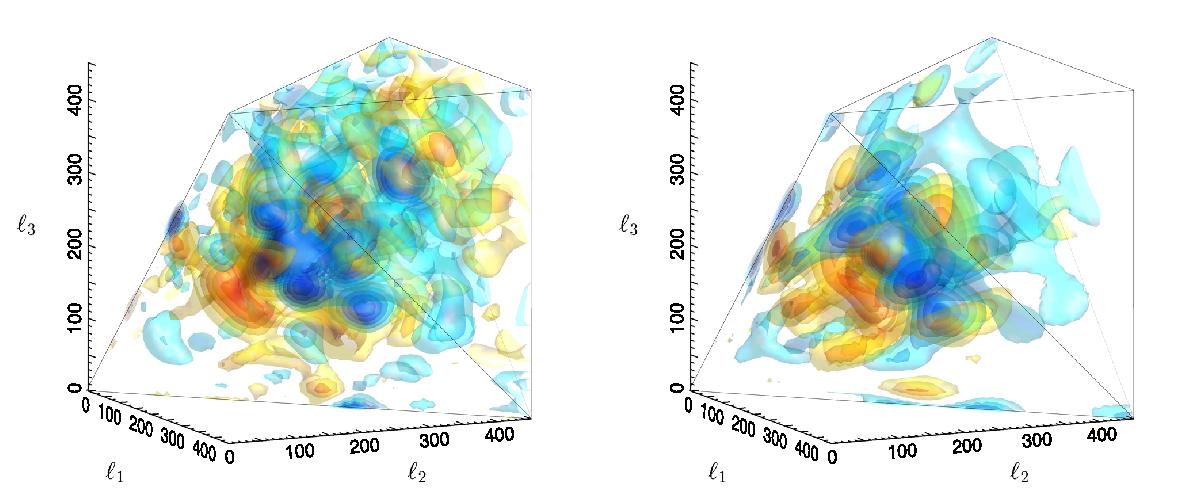
Modal reconstruction for the WMAP-9 bispectrum (left) and the Planck SMICA 2015 T-only bispectrum (right) plotted for the domain ℓ ≤ 450, using identical isosurface levels. Here, we employed the full 2001 eigenmodes for both the Planck analysis at ℓmax = 2000 and for WMAP-9 analysis at ℓmax = 600, but for comparison purposes we have only used the first 600 eigenmodes in order to obtain a comparable resolution. The main features in the WMAP-9 bispectrum have counterparts in the Planck version, revealing an oscillatory pattern in the central region, as well as features on the tetrapyd surface. The WMAP-9 bispectrum has a much larger noise signal beyond ℓ = 350 than the more sensitive Planck experiment, leading to apparent residuals in this region.
Current usage metrics show cumulative count of Article Views (full-text article views including HTML views, PDF and ePub downloads, according to the available data) and Abstracts Views on Vision4Press platform.
Data correspond to usage on the plateform after 2015. The current usage metrics is available 48-96 hours after online publication and is updated daily on week days.
Initial download of the metrics may take a while.