Fig. 4
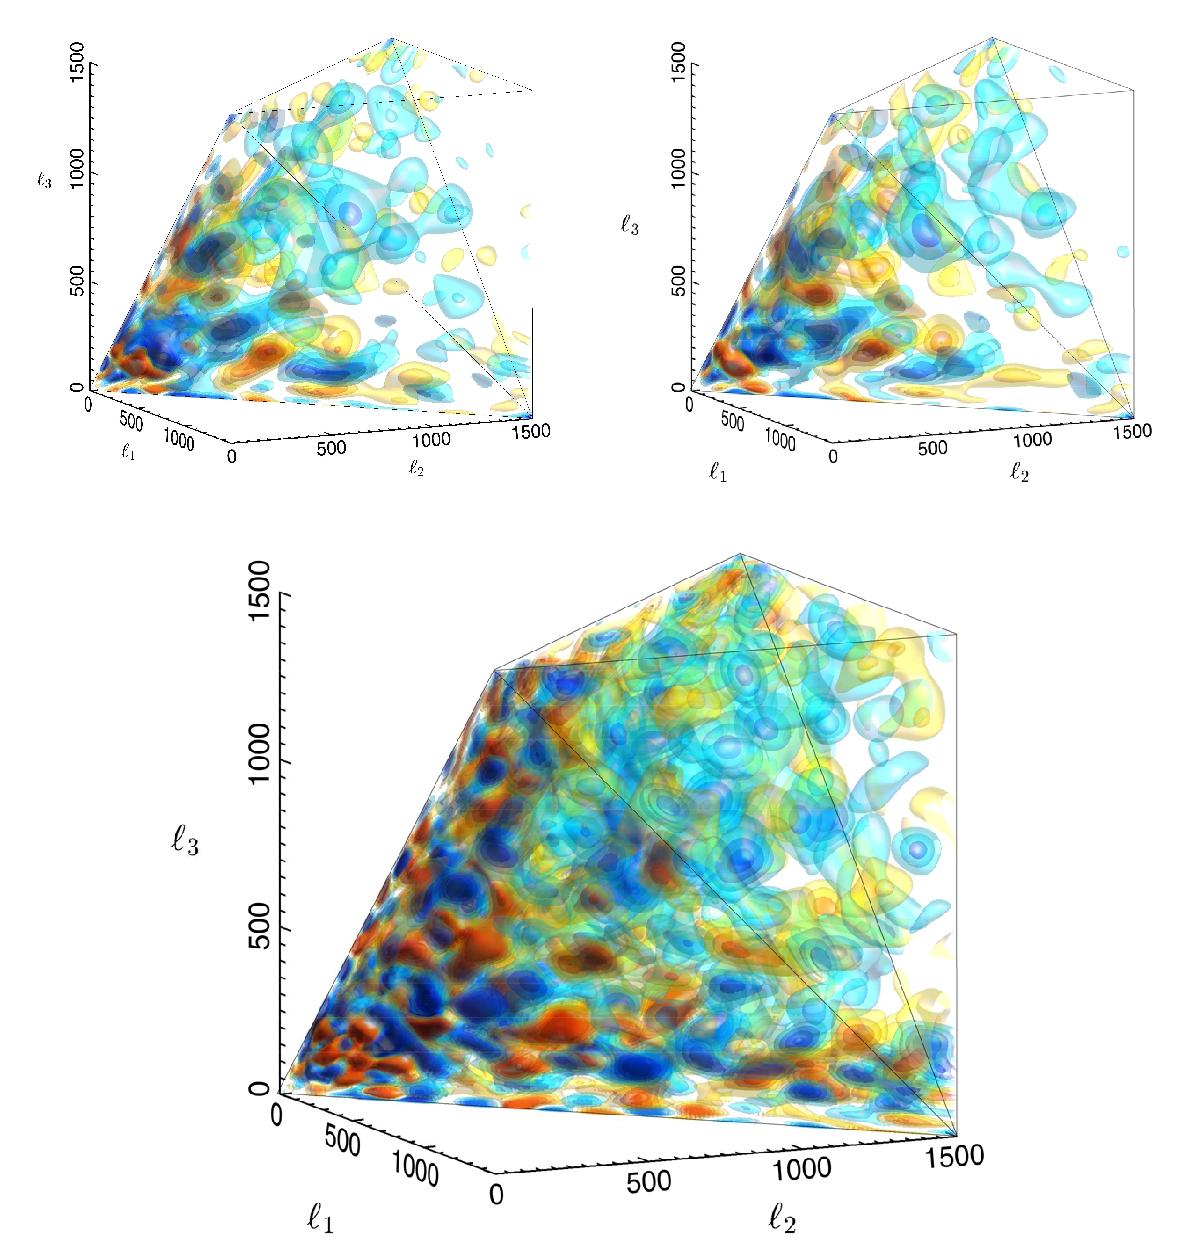
Modal bispectrum reconstruction for Planck 2013 (top left) and 2015 (top right) temperature-only data, both using the SMICA maps. Here, we restrict the 2015 resolution to the same as 2013, using similar polynomials with nmax = 601. The two bispectra are very close to being in complete agreement in the signal-dominated regime shown up to ℓmax = 1500. In the lower panel, we show the Planck 2015 temperature bispectrum at high resolution using the full nmax = 2001 polynomial modes. Large-scale features in the top panels become subdivided but the main 2013 signals remain, notably a stronger measurement of the ISW-lensing signal (the regular oscillations in the squeezed limit).
Current usage metrics show cumulative count of Article Views (full-text article views including HTML views, PDF and ePub downloads, according to the available data) and Abstracts Views on Vision4Press platform.
Data correspond to usage on the plateform after 2015. The current usage metrics is available 48-96 hours after online publication and is updated daily on week days.
Initial download of the metrics may take a while.