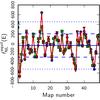
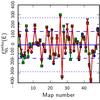
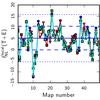
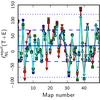
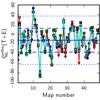
Fig. 3
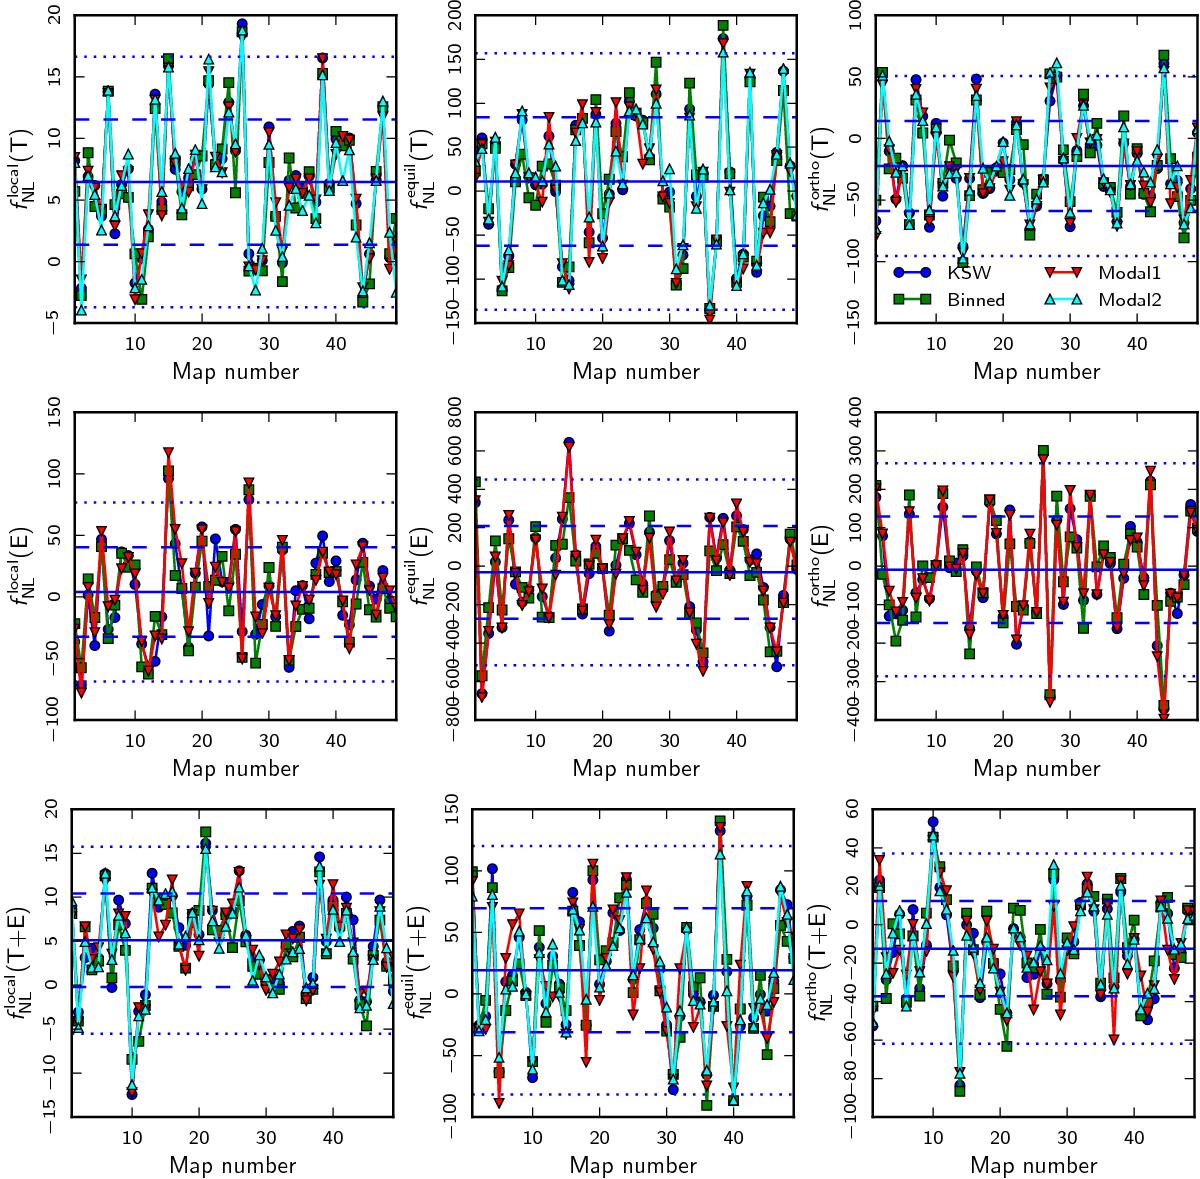
Map-by-map comparison of the results from the different estimators for local (left), equilateral (centre), and orthogonal (right) fNL (taking the shapes to be independent), for the third set of simulations described in Sect. 5.1, including both noise and a mask. Results are shown for T-only (top), E-only (centre), and the full combined T+E case (bottom). The legend for the estimators can be found in the top right figure. The horizontal solid line is the average value of all maps for KSW, and the dashed and dotted horizontal lines correspond to ± 1σ and ± 2σ deviations, respectively.

Current usage metrics show cumulative count of Article Views (full-text article views including HTML views, PDF and ePub downloads, according to the available data) and Abstracts Views on Vision4Press platform.
Data correspond to usage on the plateform after 2015. The current usage metrics is available 48-96 hours after online publication and is updated daily on week days.
Initial download of the metrics may take a while.