Fig. 24
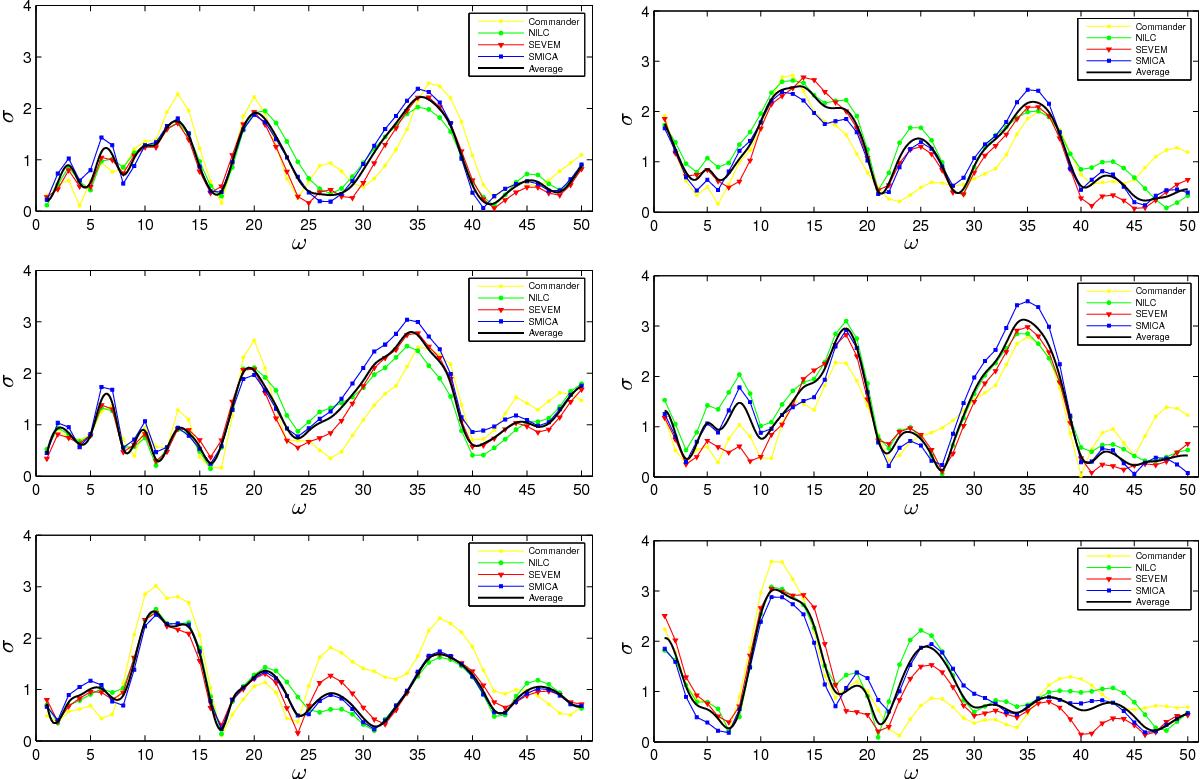
Generalized resonance models analysed at ℓmax = 2000 (E-modes ℓmax = 1500) for the different Planck foreground separation methods, SMICA (blue), SEVEM (red), NILC (green), and Commander (yellow), together with the SSN (SMICA – SEVEM – NILC ) average (black). The upper panels apply to the constant resonance model (Eq. (10)), with T-only (left) and T+E (right), the middle panels give results for the equilateral resonance model (Eq. (13)), and the lower panels for the flattened resonance model (Eq. (14)). Both the equilateral and flattened resonance models produce broad peaks, which are reinforced with polarization (middle and bottom right panels).
Current usage metrics show cumulative count of Article Views (full-text article views including HTML views, PDF and ePub downloads, according to the available data) and Abstracts Views on Vision4Press platform.
Data correspond to usage on the plateform after 2015. The current usage metrics is available 48-96 hours after online publication and is updated daily on week days.
Initial download of the metrics may take a while.