Fig. 20
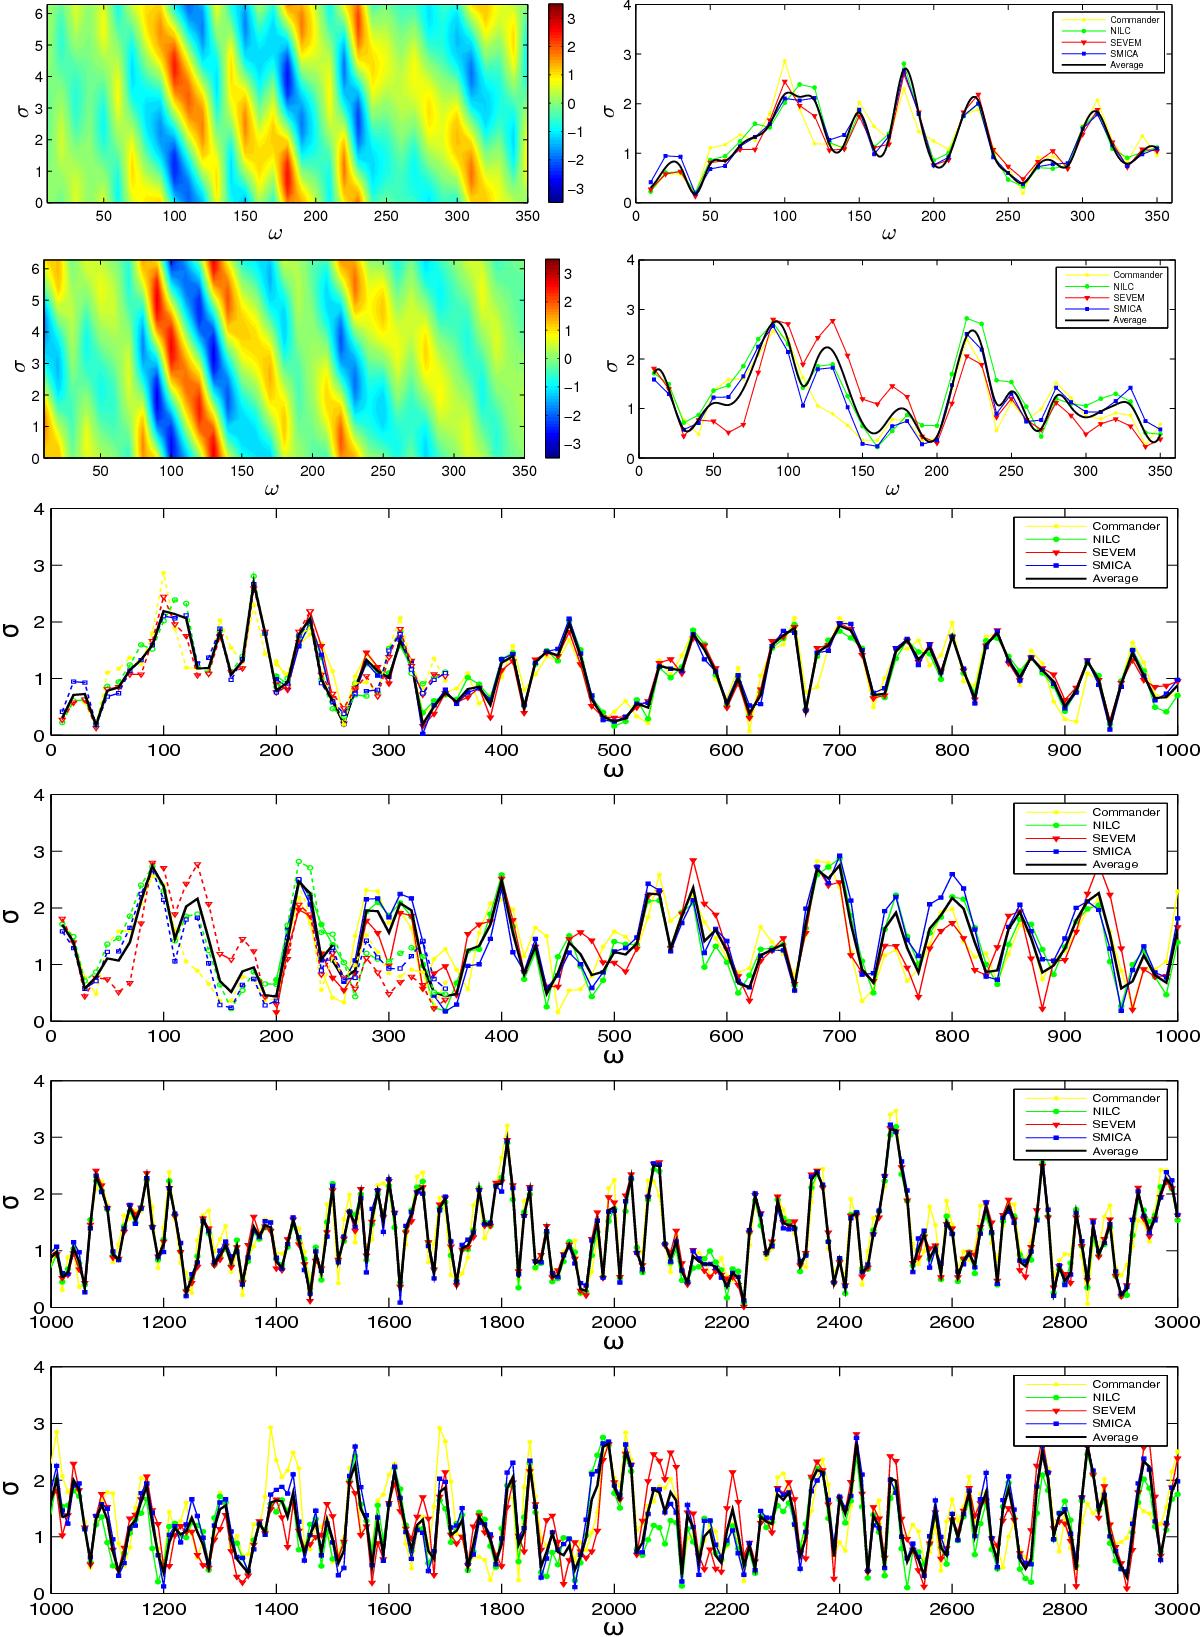
Constant feature model results for both T-only and T+E data across a wide frequency range. The upper four panels show the feature signal in the Modal range 0 <ω< 350. The two upper left panels show contours of the raw significance σ obtained from the SMICA map as a function of the frequency ω, for T-only and T+E, respectively. The upper right panels show the maximum signal after marginalizing over phase φ for both T-only and T+E for all foreground separation models. The third and fourth panels show the maximum feature signal in both T-only and T+E across the frequency range 0 <ω< 1000, plotting both Modal results (dashed lines) and KSW results (solid lines for 200 <ω< 1000); these show good agreement in the overlap. The lower two panels give the maximum KSW results for T-only and T+E in the range 1000 <ω< 3000).
Current usage metrics show cumulative count of Article Views (full-text article views including HTML views, PDF and ePub downloads, according to the available data) and Abstracts Views on Vision4Press platform.
Data correspond to usage on the plateform after 2015. The current usage metrics is available 48-96 hours after online publication and is updated daily on week days.
Initial download of the metrics may take a while.