Free Access
Fig. 2
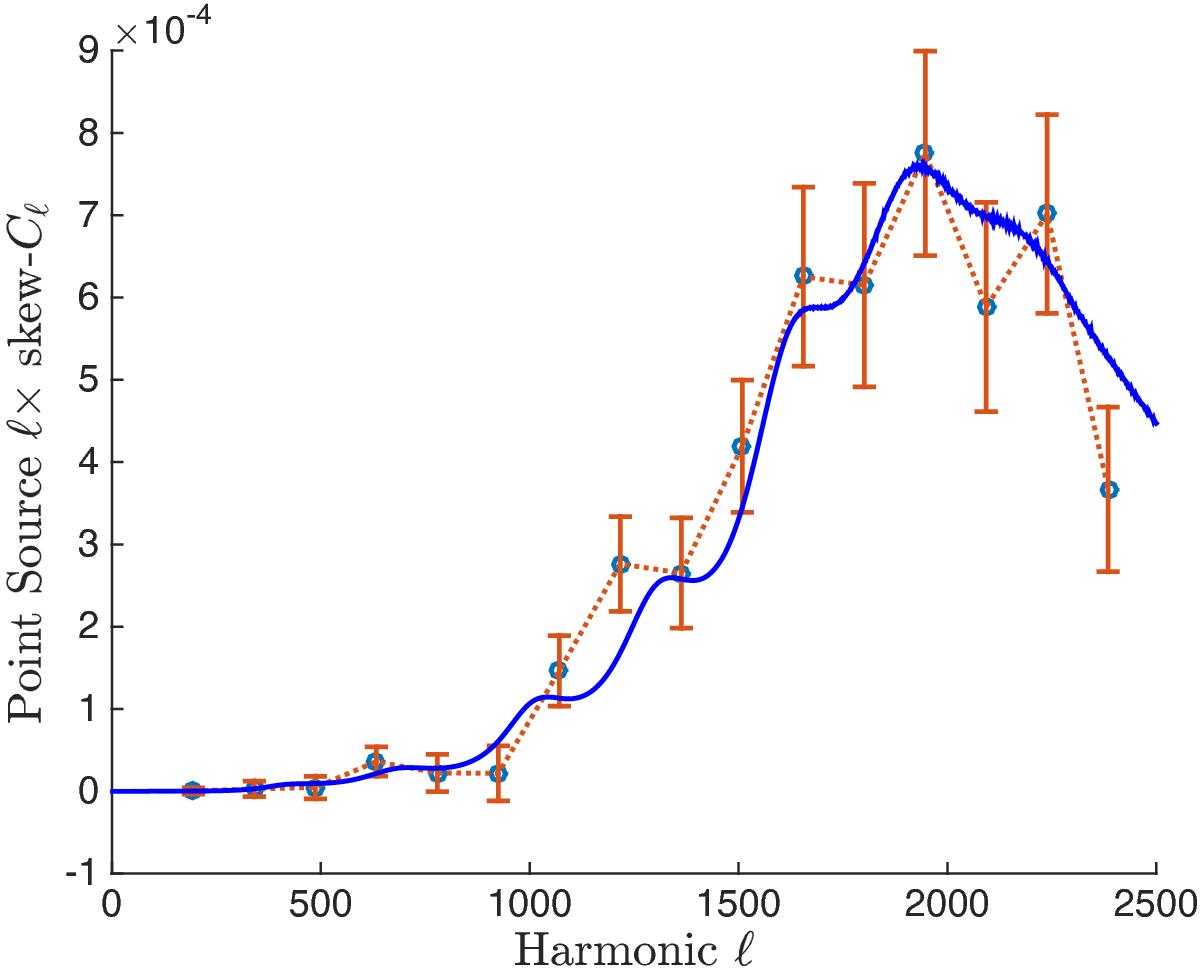
Skew-Cℓ spectrum for unclustered point sources (red line with data points), from the temperature map. The blue curve is the theoretical spectrum, given the amplitude determined with the KSW estimator.
Current usage metrics show cumulative count of Article Views (full-text article views including HTML views, PDF and ePub downloads, according to the available data) and Abstracts Views on Vision4Press platform.
Data correspond to usage on the plateform after 2015. The current usage metrics is available 48-96 hours after online publication and is updated daily on week days.
Initial download of the metrics may take a while.