Fig. 19
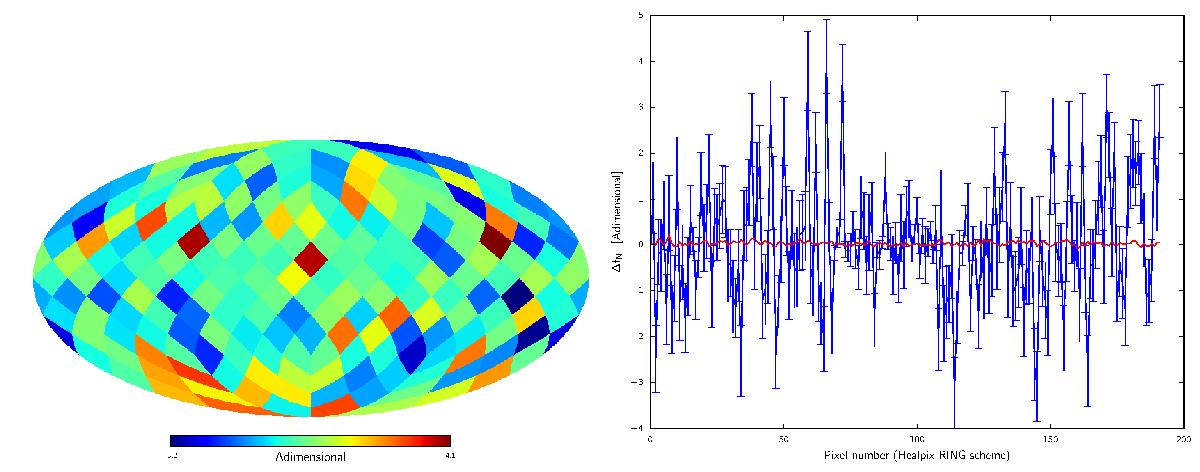
Temperature only, local fNL directional contributions from SMICA. As explained in the text, summing over all the pixel values would give the full sky fNL needlet estimator result. The left panel displays the directional fNL map. On the right, the blue points represent the fNL contibution for each direction (i.e., for each pixel in the directional map), with Monte Carlo error bars. The red line is the average from simulations, which is consistent with zero.
Current usage metrics show cumulative count of Article Views (full-text article views including HTML views, PDF and ePub downloads, according to the available data) and Abstracts Views on Vision4Press platform.
Data correspond to usage on the plateform after 2015. The current usage metrics is available 48-96 hours after online publication and is updated daily on week days.
Initial download of the metrics may take a while.