Free Access
Fig. 18
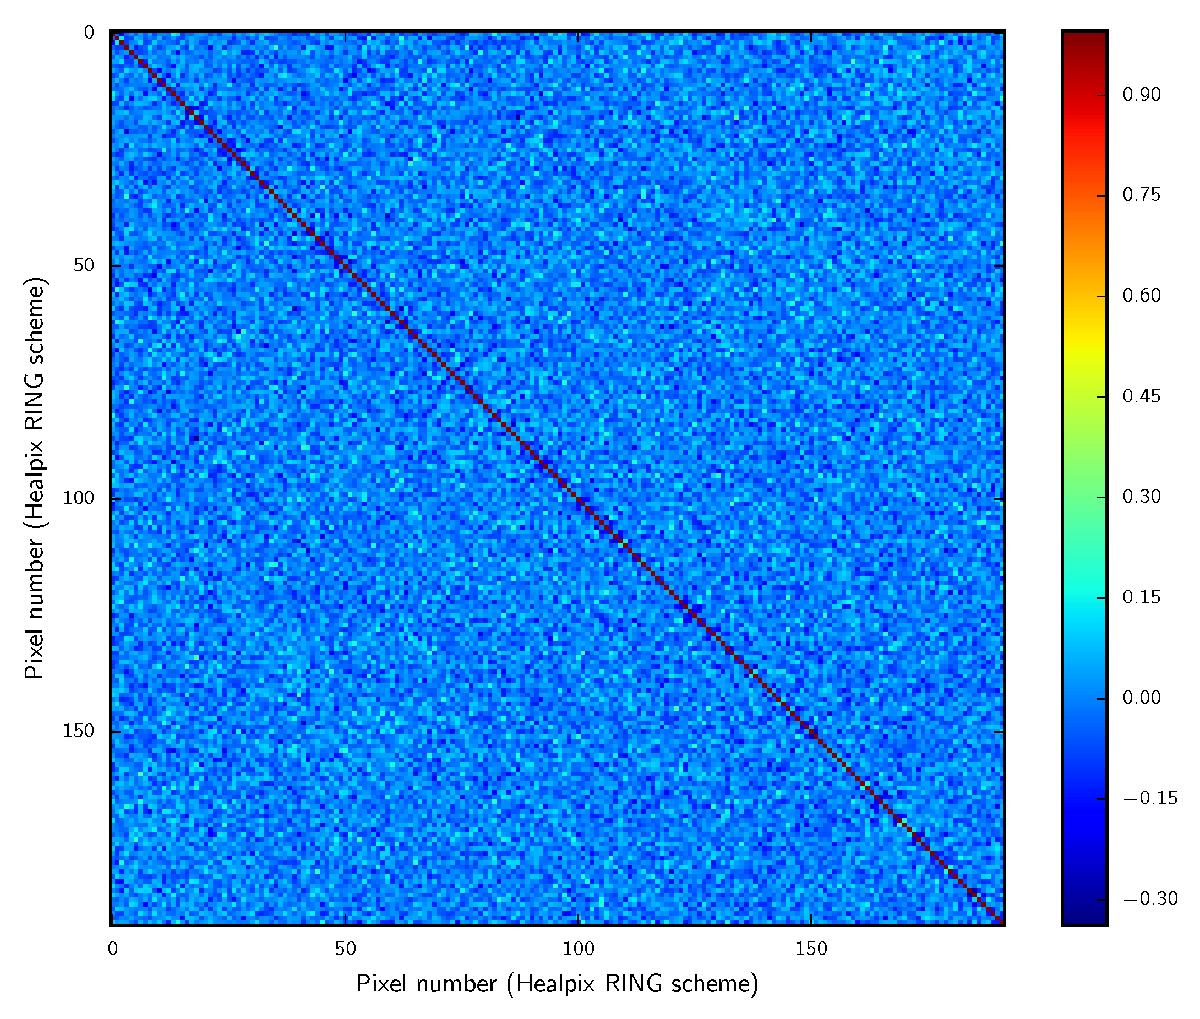
Temperature only, local shape, pixel correlation matrix from Monte Carlo analysis, at Nside = 4. The most correlated pixels are those closest to the main diagonal; however, these values are always lower than 34% in the chosen case.
Current usage metrics show cumulative count of Article Views (full-text article views including HTML views, PDF and ePub downloads, according to the available data) and Abstracts Views on Vision4Press platform.
Data correspond to usage on the plateform after 2015. The current usage metrics is available 48-96 hours after online publication and is updated daily on week days.
Initial download of the metrics may take a while.