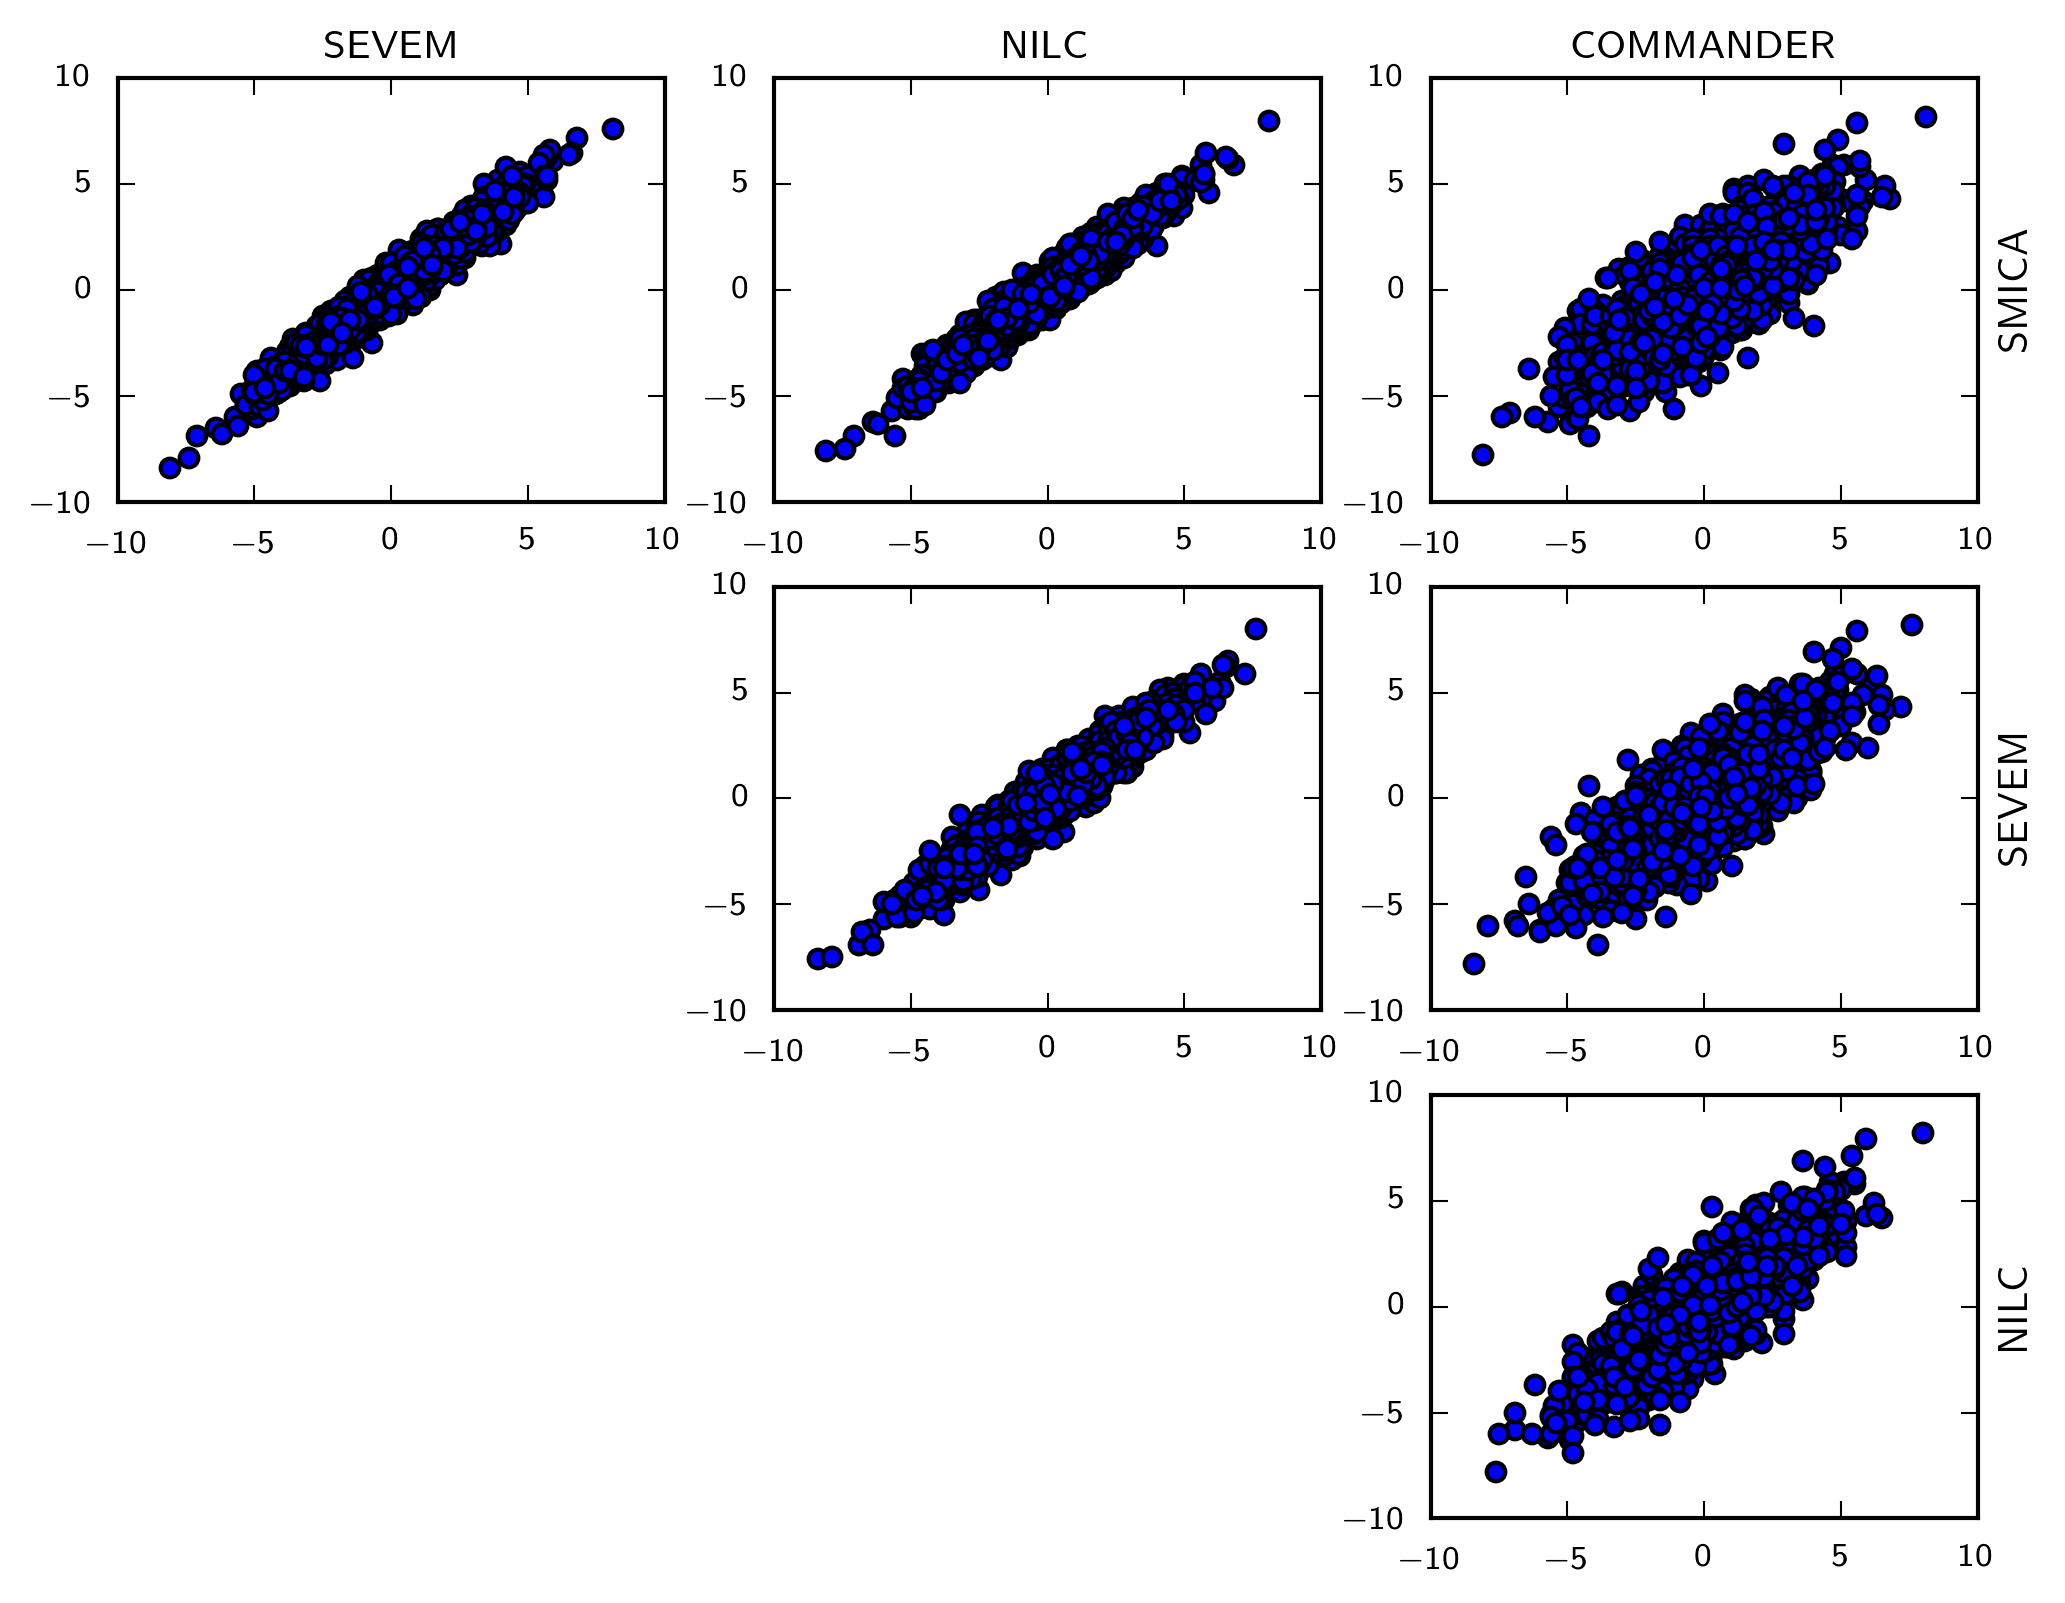
Fig. 15
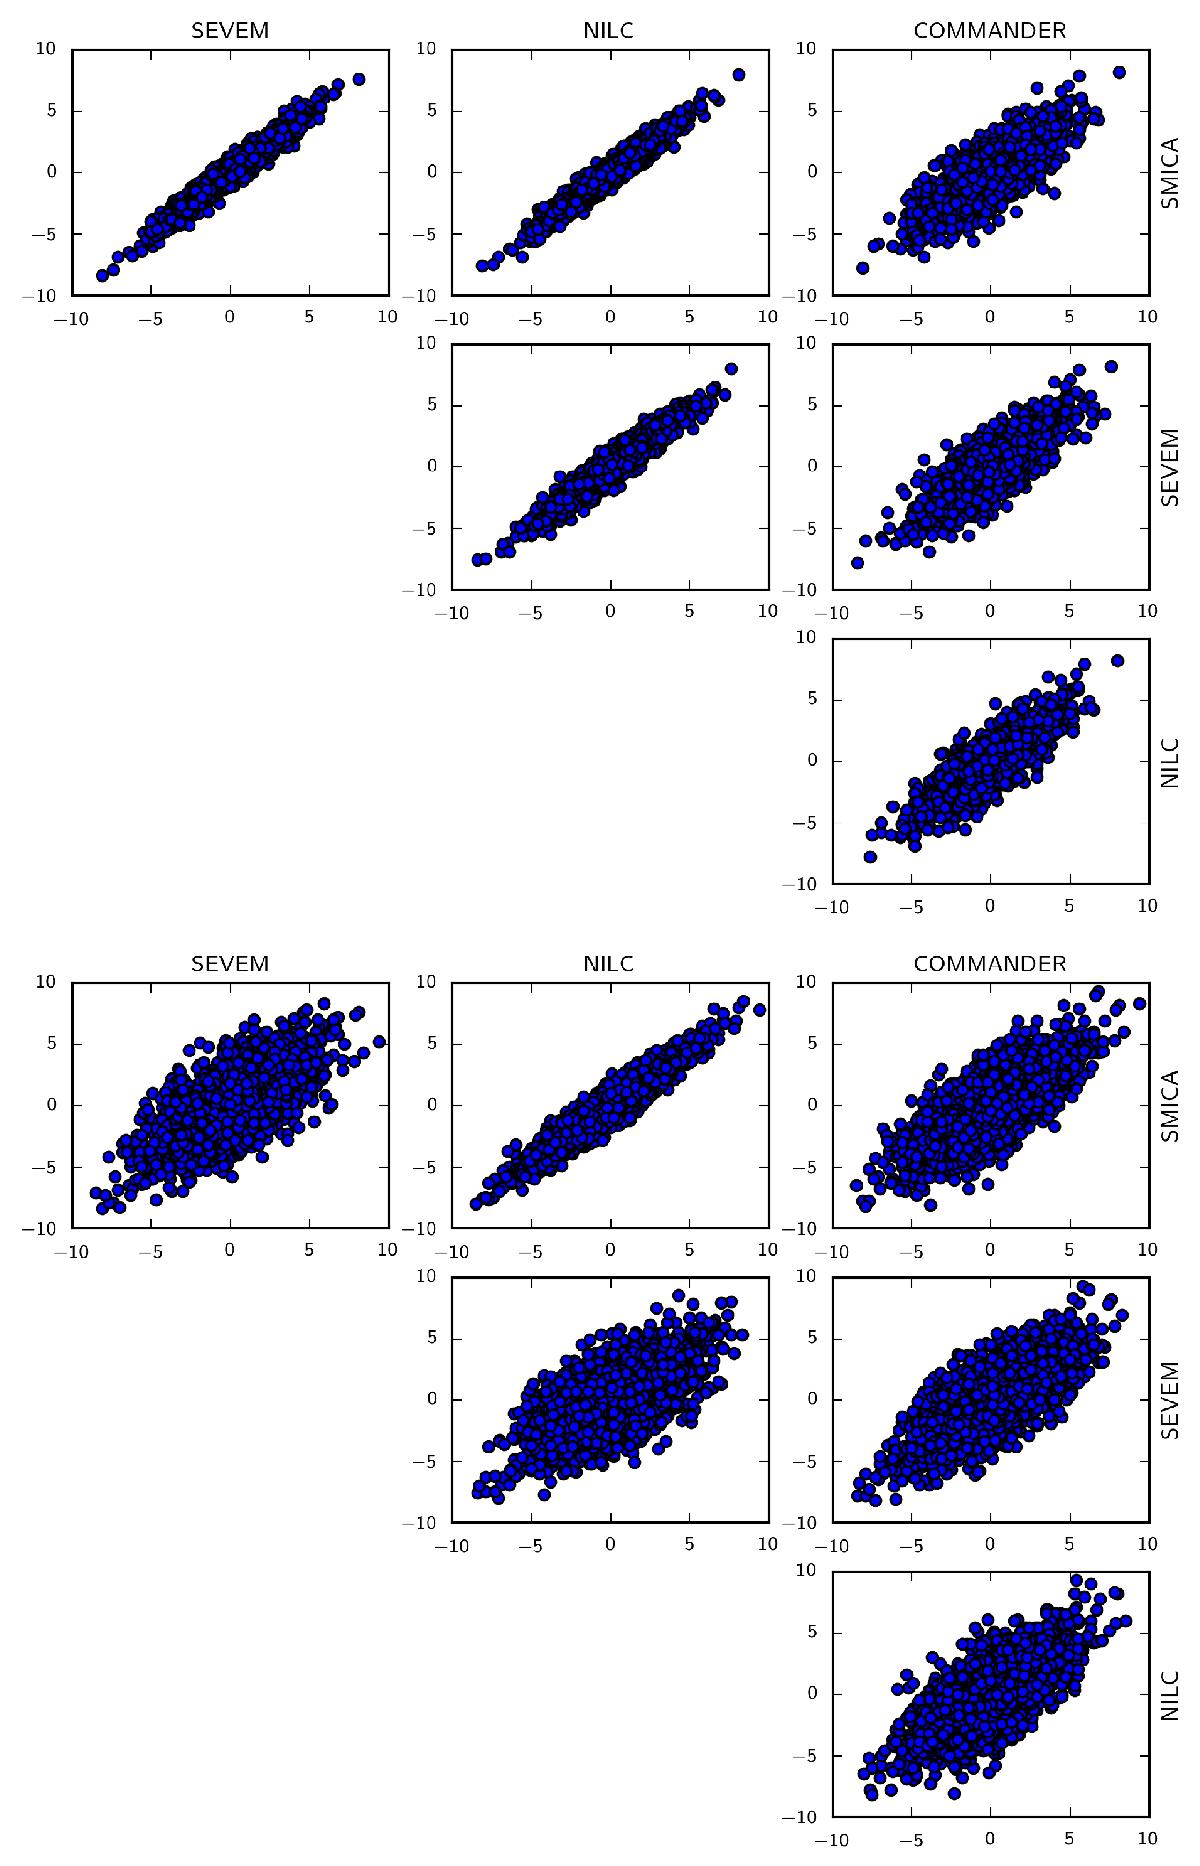
Scatter plots showing correlations between bispectrum modes extracted from the different Planck foreground-cleaned maps, for all possible pairs of component separation methods. Top: TTT bispectrum modes. Bottom: EEE bispectrum modes. While temperature shows a strong correlation, the loss of correlation in polarization between the different methods is evident in these plots, as discussed in the text and quantified in Tables 14 and 15. Results here and in Table 15 have been obtained using the high resolution modal pipeline (2001 modes), while results in Table 14 have been obtained with the low resolution modal pipeline. By construction, the high resolution pipeline is measuring not the full EEE bispectrum of the map, but the component of EEE that is orthogonal to TTT. For this reason, r2 measured by the two pipelines for EEE will not be identical. With this caveat in mind, the agreement between the two modal approaches is very good.
Current usage metrics show cumulative count of Article Views (full-text article views including HTML views, PDF and ePub downloads, according to the available data) and Abstracts Views on Vision4Press platform.
Data correspond to usage on the plateform after 2015. The current usage metrics is available 48-96 hours after online publication and is updated daily on week days.
Initial download of the metrics may take a while.