Free Access
Fig. 4
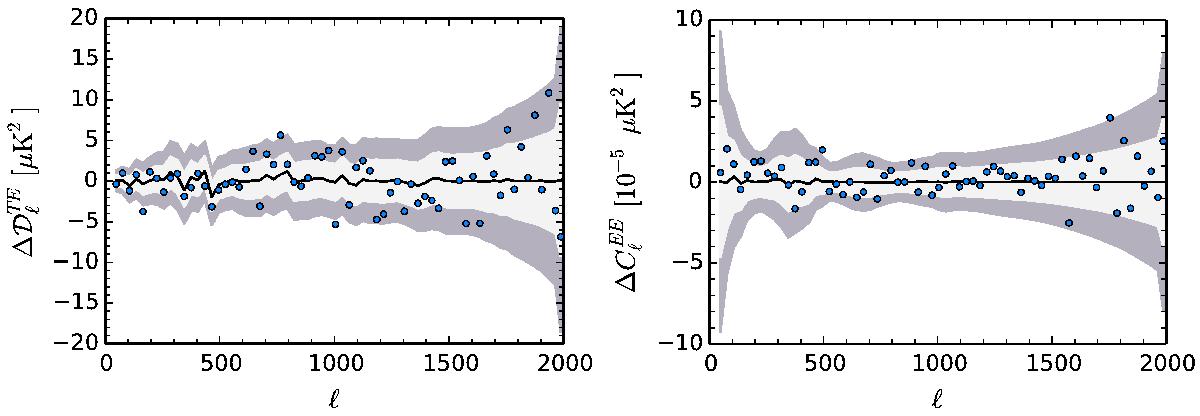
Conditionals for the PlikTE and EE spectra, given the TT data computed from the Plik likelihood. The black lines show the expected TE and EE spectra given the TT data. The shaded areas show the ± 1 and ± 2σ ranges computed from Eq. (16). The blue points show the residuals for the measured TE and EE spectra.
This figure is made of several images, please see below:
Current usage metrics show cumulative count of Article Views (full-text article views including HTML views, PDF and ePub downloads, according to the available data) and Abstracts Views on Vision4Press platform.
Data correspond to usage on the plateform after 2015. The current usage metrics is available 48-96 hours after online publication and is updated daily on week days.
Initial download of the metrics may take a while.