Fig. 25
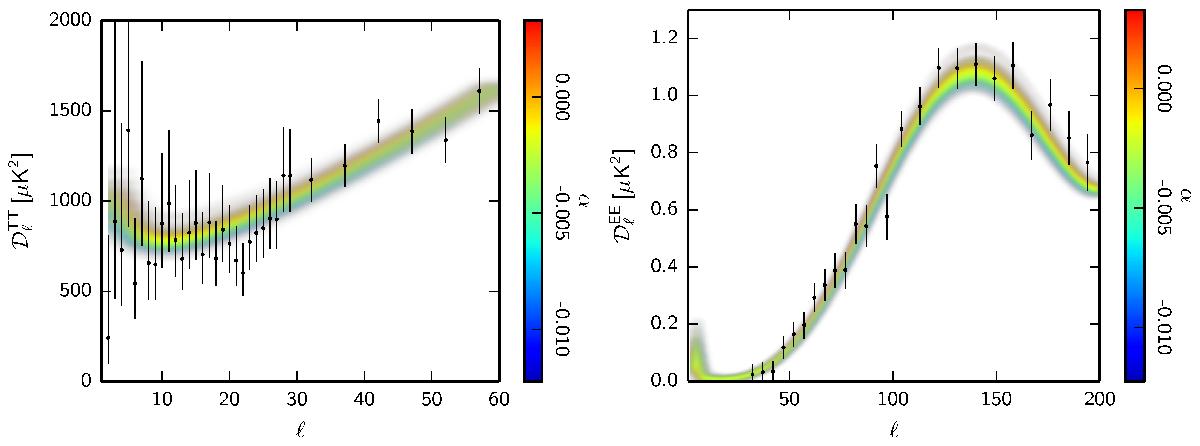
Power spectra drawn from the Planck TT+lowP posterior for the correlated matter isocurvature model, colour-coded by the value of the isocurvature amplitude parameter α, compared to the Planck data points. The left-hand figure shows how the negatively-correlated modes lower the large-scale temperature spectrum, slightly improving the fit at low multipoles. Including polarization, the negatively-correlated modes are disfavoured, as illustrated at the first acoustic peak in EE on the right-hand plot. Data points at ℓ< 30 are not shown for polarization, as they are included with both the default temperature (i.e., TT+lowP) and polarization (i.e., TT,TE,EE+lowP) likelihood combinations.
Current usage metrics show cumulative count of Article Views (full-text article views including HTML views, PDF and ePub downloads, according to the available data) and Abstracts Views on Vision4Press platform.
Data correspond to usage on the plateform after 2015. The current usage metrics is available 48-96 hours after online publication and is updated daily on week days.
Initial download of the metrics may take a while.