Fig. 2
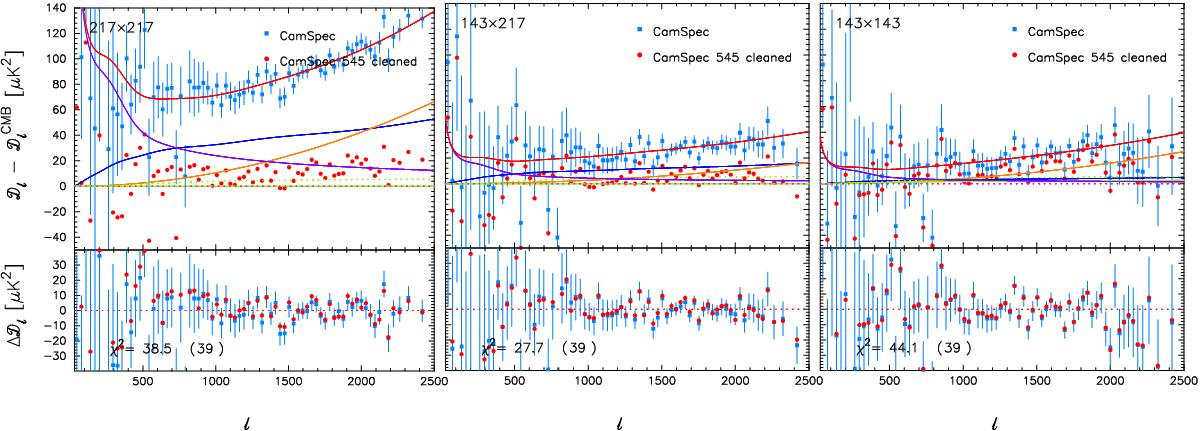
Residual plots illustrating the accuracy of the foreground modelling. The blue points in the upper panels show the CamSpec 2015(CHM) spectra after subtraction of the best-fit ΛCDM spectrum. The residuals in the upper panel should be accurately described by the foreground model. Major foreground components are shown by the solid lines, colour coded as follows: total foreground spectrum (red); Poisson point sources (orange); clustered CIB (blue); thermal SZ (green); and Galactic dust (purple). Minor foreground components are shown by the dotted lines, colour-coded as follows: kinetic SZ (green); and tSZ×CIB cross-correlation (purple). The red points in the upper panels show the 545-GHz-cleaned spectra (minus the best-fit CMB as subtracted from the uncleaned spectra) that are fitted to a power-law residual foreground model, as discussed in the text. The lower panels show the spectra after subtraction of the best-fit foreground models. These agree to within a few (μK)2. The χ2 values of the residuals of the blue points, and the number of bandpowers, are listed in the lower panels.
Current usage metrics show cumulative count of Article Views (full-text article views including HTML views, PDF and ePub downloads, according to the available data) and Abstracts Views on Vision4Press platform.
Data correspond to usage on the plateform after 2015. The current usage metrics is available 48-96 hours after online publication and is updated daily on week days.
Initial download of the metrics may take a while.