Fig. 14
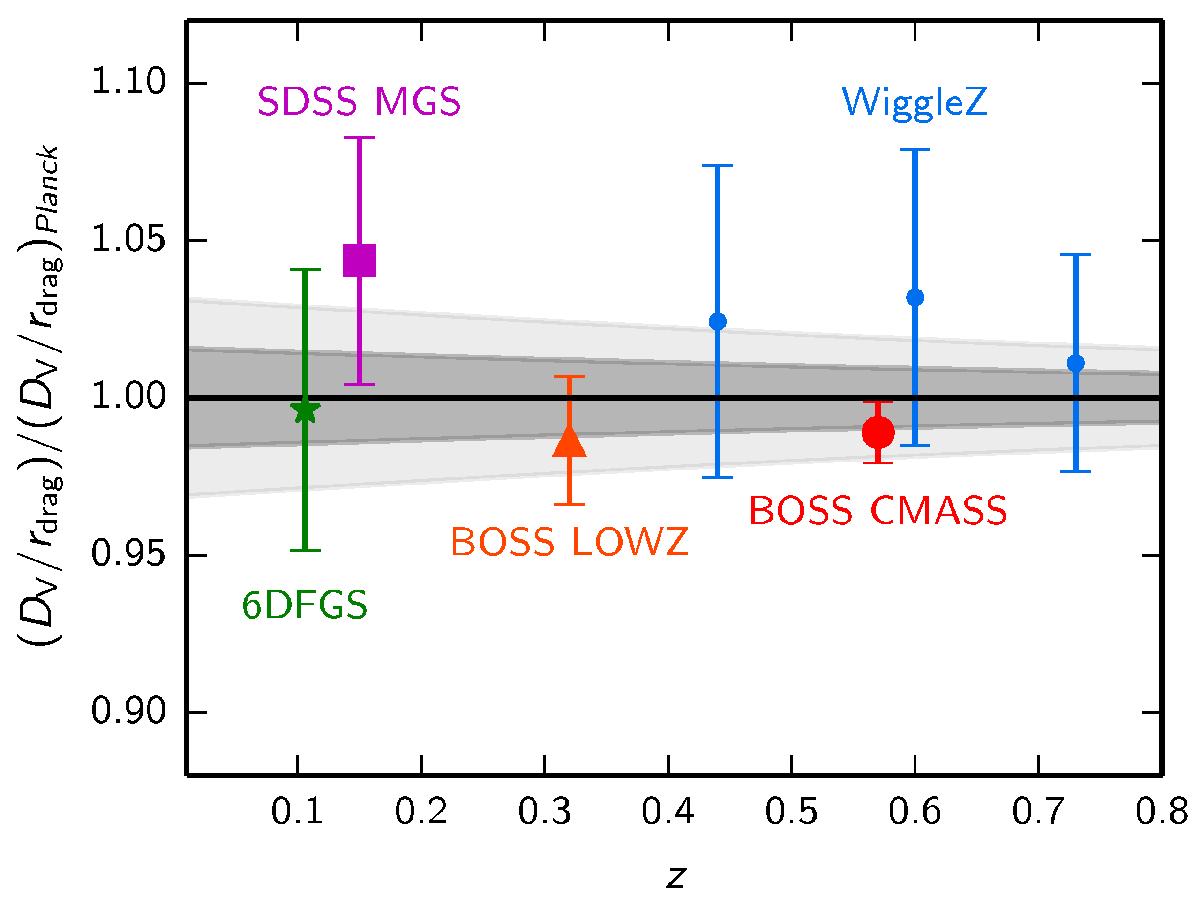
Acoustic-scale distance ratio DV(z) /rdrag in the base ΛCDM model divided by the mean distance ratio from Planck TT+lowP+lensing. The points with 1σ errors are as follows: green star (6dFGS, Beutler et al. 2011); square (SDSS MGS, Ross et al. 2015); red triangle and large circle (BOSS “LOWZ” and CMASS surveys, Anderson et al. 2014); and small blue circles (WiggleZ, as analysed by Kazin et al. 2014). The grey bands show the 68% and 95% confidence ranges allowed by Planck TT+lowP+lensing.
Current usage metrics show cumulative count of Article Views (full-text article views including HTML views, PDF and ePub downloads, according to the available data) and Abstracts Views on Vision4Press platform.
Data correspond to usage on the plateform after 2015. The current usage metrics is available 48-96 hours after online publication and is updated daily on week days.
Initial download of the metrics may take a while.