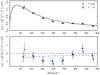
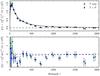
Fig. 11

Planck measurements of the lensing power spectrum compared to the prediction for the best-fitting base ΛCDM model to the Planck TT+lowP data. Left: the conservative cut of the Planck lensing data used throughout this paper, covering the multipole range 40 ≤ ℓ ≤ 400. Right: lensing data over the range 8 ≤ ℓ ≤ 2048, demonstrating the general consistency with the ΛCDM prediction over this extended multipole range. In both cases, green points are the power from lensing reconstructions using only temperature data, while blue points combine temperature and polarization. They are offset in ℓ for clarity and error bars are ± 1σ. In the top panels the solid lines are the best-fitting base ΛCDM model to the Planck TT+lowP data with no renormalization or δN(1) correction applied (see text for explanation). The bottom panels show the difference between the data and the renormalized and δN(1)-corrected theory bandpowers, which enter the likelihood. The mild preference of the lensing measurements for lower lensing power around ℓ = 200 pulls the theoretical prediction for ![]() downwards at the best-fitting parameters of a fit to the combined Planck TT+lowP+lensing data, shown by the dashed blue lines (always for the conservative cut of the lensing data, including polarization).
downwards at the best-fitting parameters of a fit to the combined Planck TT+lowP+lensing data, shown by the dashed blue lines (always for the conservative cut of the lensing data, including polarization).
Current usage metrics show cumulative count of Article Views (full-text article views including HTML views, PDF and ePub downloads, according to the available data) and Abstracts Views on Vision4Press platform.
Data correspond to usage on the plateform after 2015. The current usage metrics is available 48-96 hours after online publication and is updated daily on week days.
Initial download of the metrics may take a while.