Fig. 1
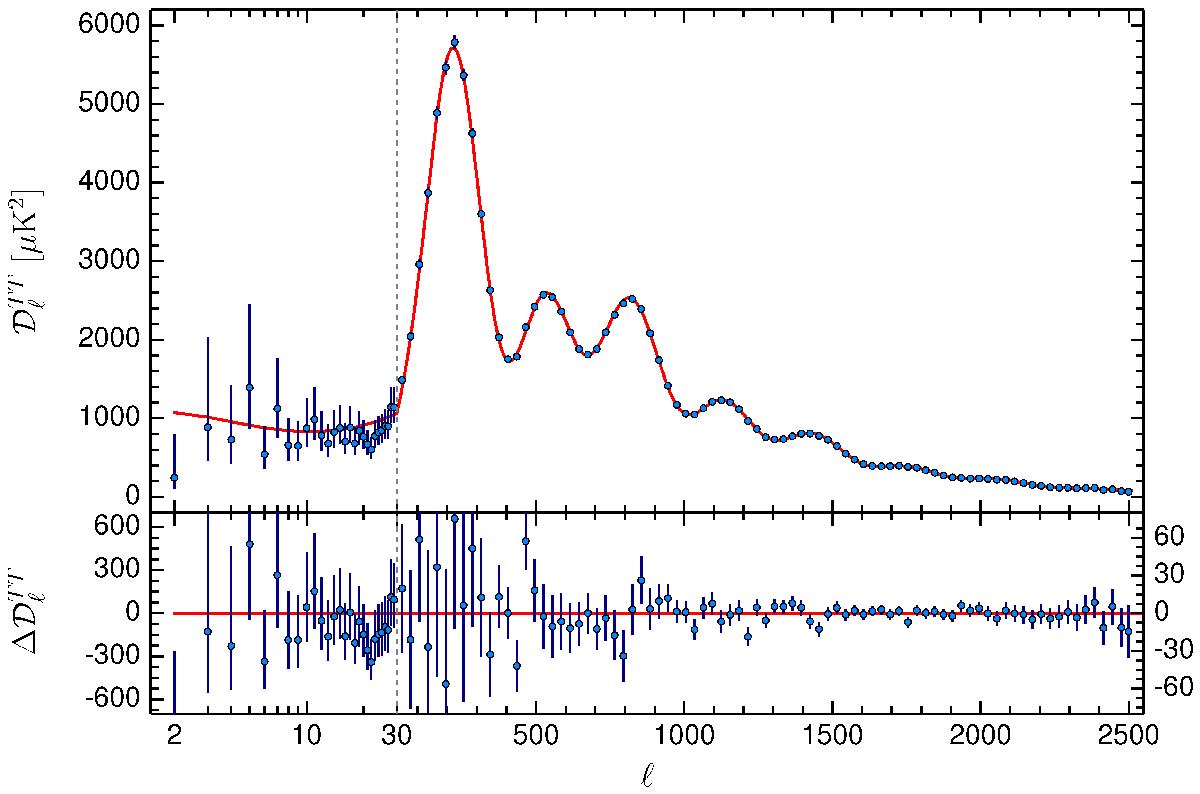
Planck 2015 temperature power spectrum. At multipoles ℓ ≥ 30 we show the maximum likelihood frequency-averaged temperature spectrum computed from the Plik cross-half-mission likelihood, with foreground and other nuisance parameters determined from the MCMC analysis of the base ΛCDM cosmology. In the multipole range 2 ≤ ℓ ≤ 29, we plot the power spectrum estimates from the Commander component-separation algorithm, computed over 94% of the sky. The best-fit base ΛCDM theoretical spectrum fitted to the Planck TT+lowP likelihood is plotted in the upper panel. Residuals with respect to this model are shown in the lower panel. The error bars show ± 1σ uncertainties.
Current usage metrics show cumulative count of Article Views (full-text article views including HTML views, PDF and ePub downloads, according to the available data) and Abstracts Views on Vision4Press platform.
Data correspond to usage on the plateform after 2015. The current usage metrics is available 48-96 hours after online publication and is updated daily on week days.
Initial download of the metrics may take a while.