Free Access
Fig. 6
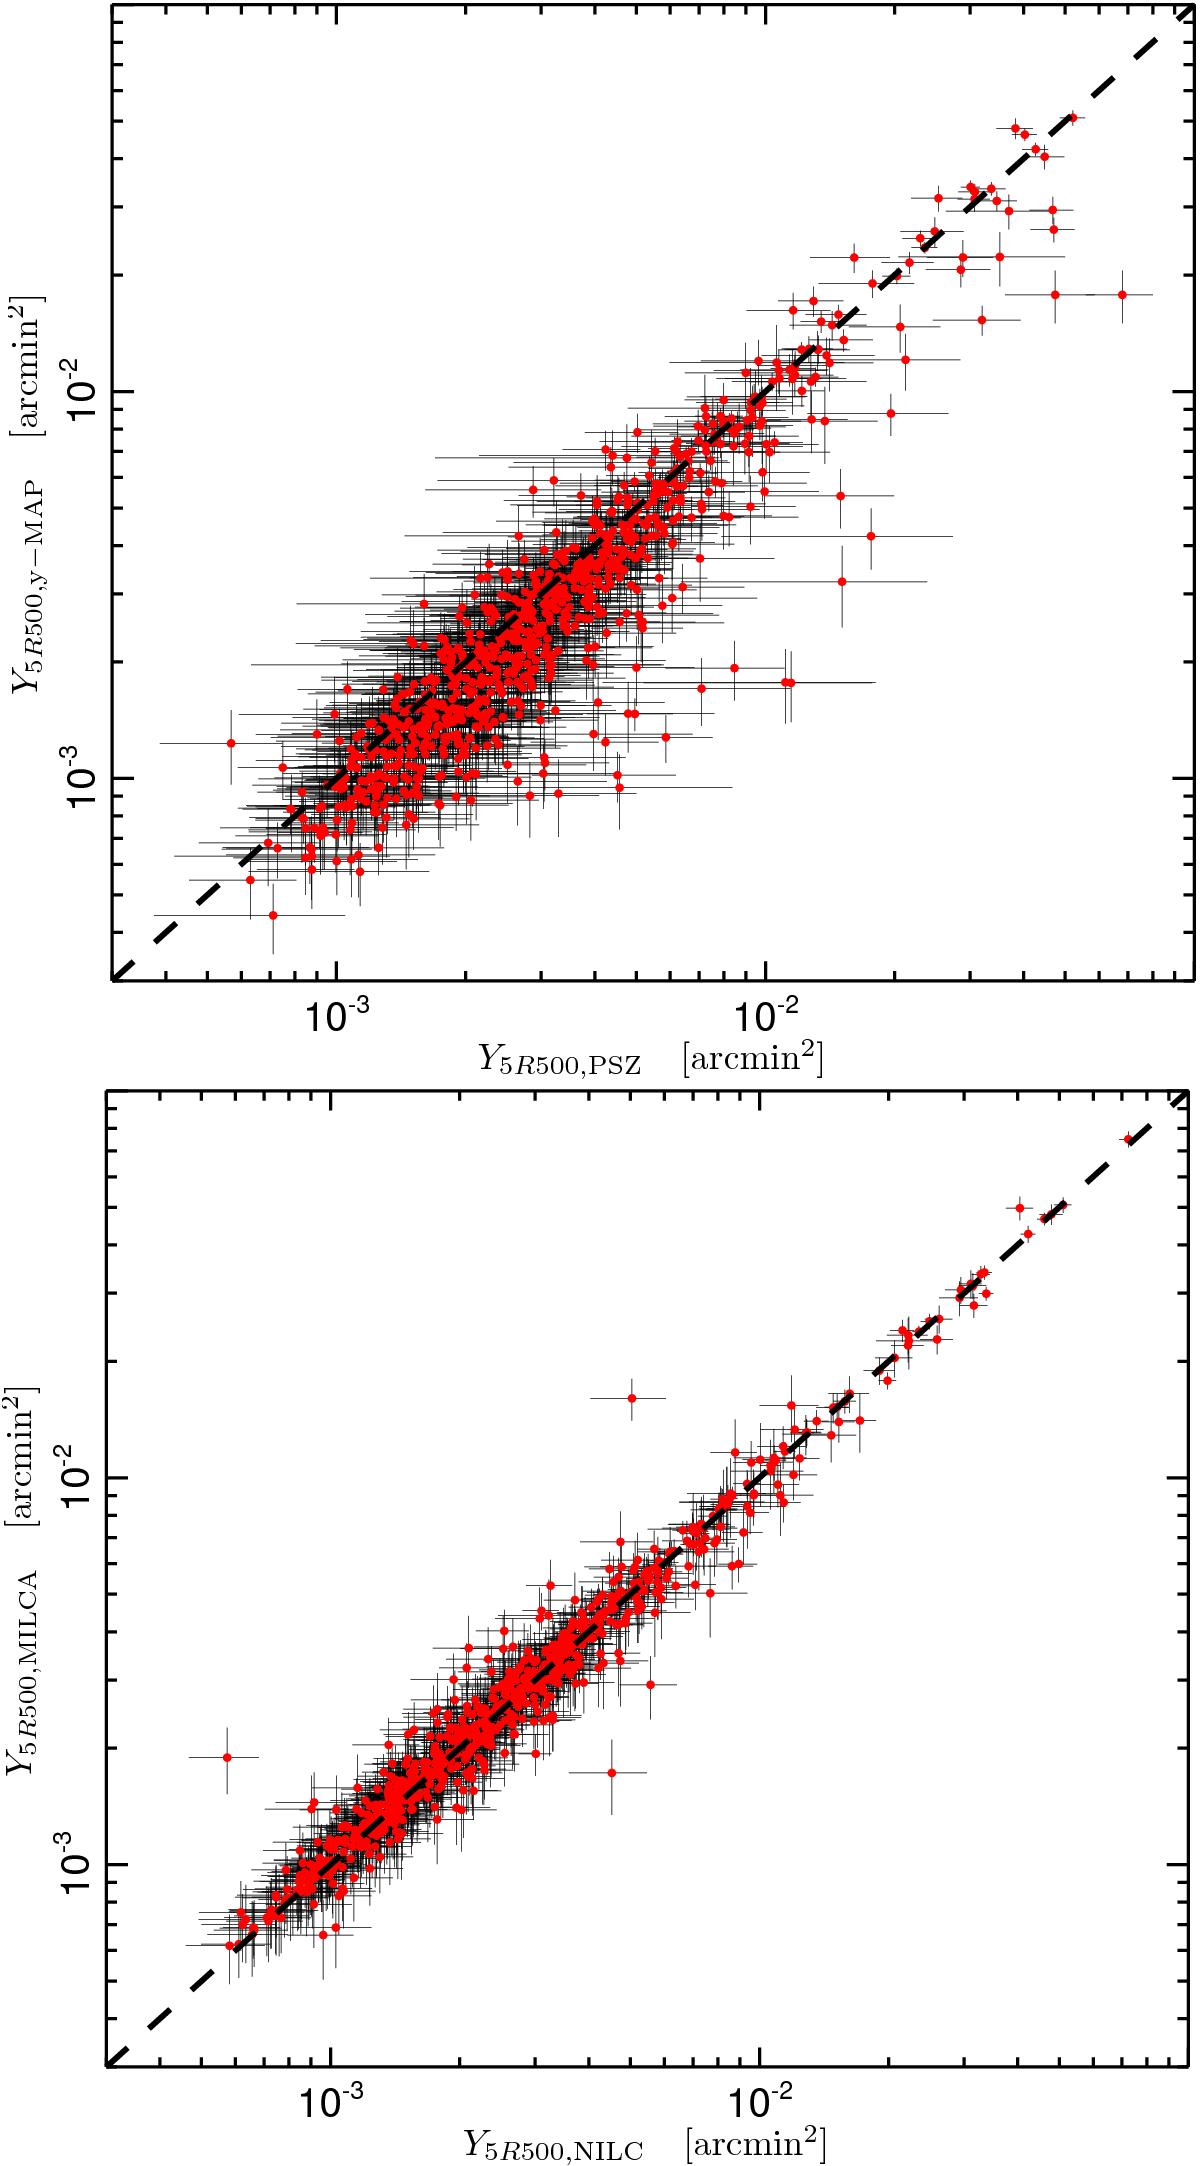
Top: comparison between the measured tSZ flux reported in the Planck cluster sample and that estimated directly on the NILC y-map for the blindly-detected common sources. Bottom: as above but for the NILC and MILCA measured fluxes. Outliers in the figures are discussed in the text.
This figure is made of several images, please see below:
Current usage metrics show cumulative count of Article Views (full-text article views including HTML views, PDF and ePub downloads, according to the available data) and Abstracts Views on Vision4Press platform.
Data correspond to usage on the plateform after 2015. The current usage metrics is available 48-96 hours after online publication and is updated daily on week days.
Initial download of the metrics may take a while.