Fig. 19
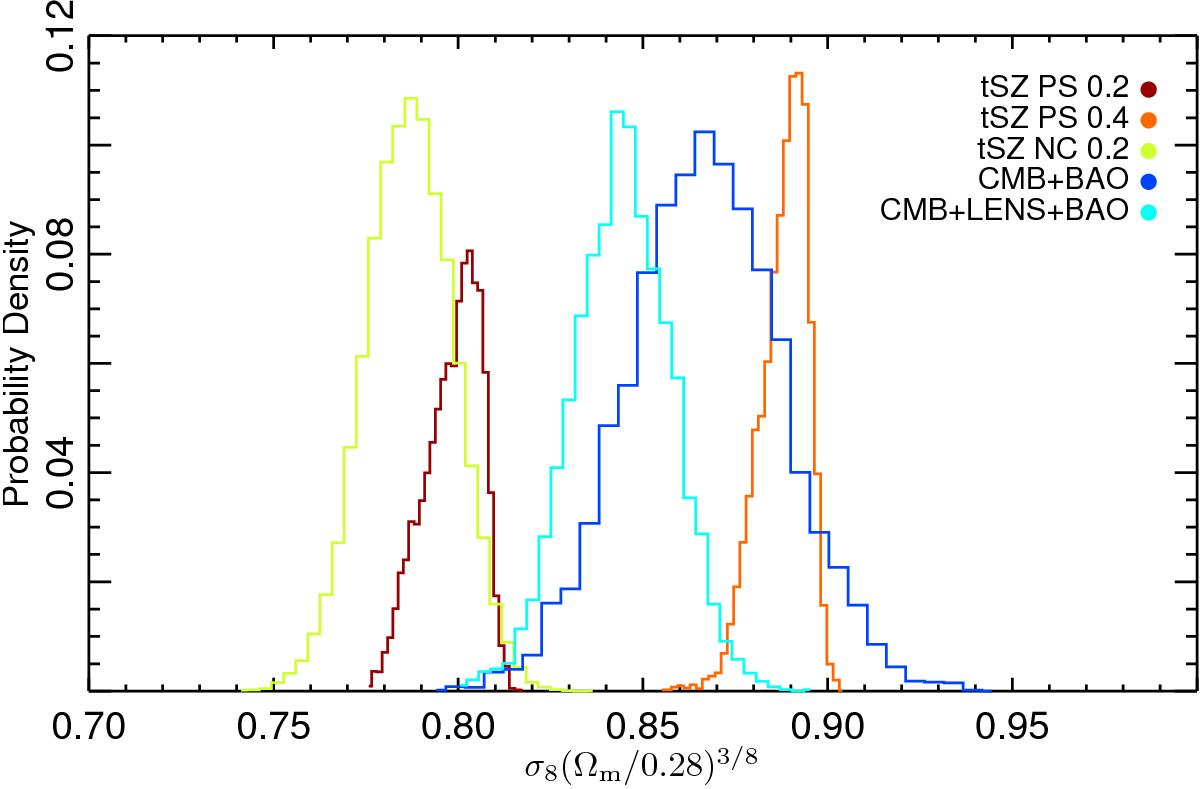
Marginalized likelihood distribution for σ8(Ωm/ 0.28)3 / 8 for tSZ– and CMB–based analyses. We represent the tSZ power spectrum analysis results assuming a mass bias, b, of 0.2 (red) and 0.4 (orange), the cluster number count analysis results (green; Planck Collaboration XXIV 2016), and the combined Planck CMB and BAO analysis (Planck Collaboration XIII 2016) with (cyan) and without (blue) extra lensing constraints.
Current usage metrics show cumulative count of Article Views (full-text article views including HTML views, PDF and ePub downloads, according to the available data) and Abstracts Views on Vision4Press platform.
Data correspond to usage on the plateform after 2015. The current usage metrics is available 48-96 hours after online publication and is updated daily on week days.
Initial download of the metrics may take a while.