Fig. 18
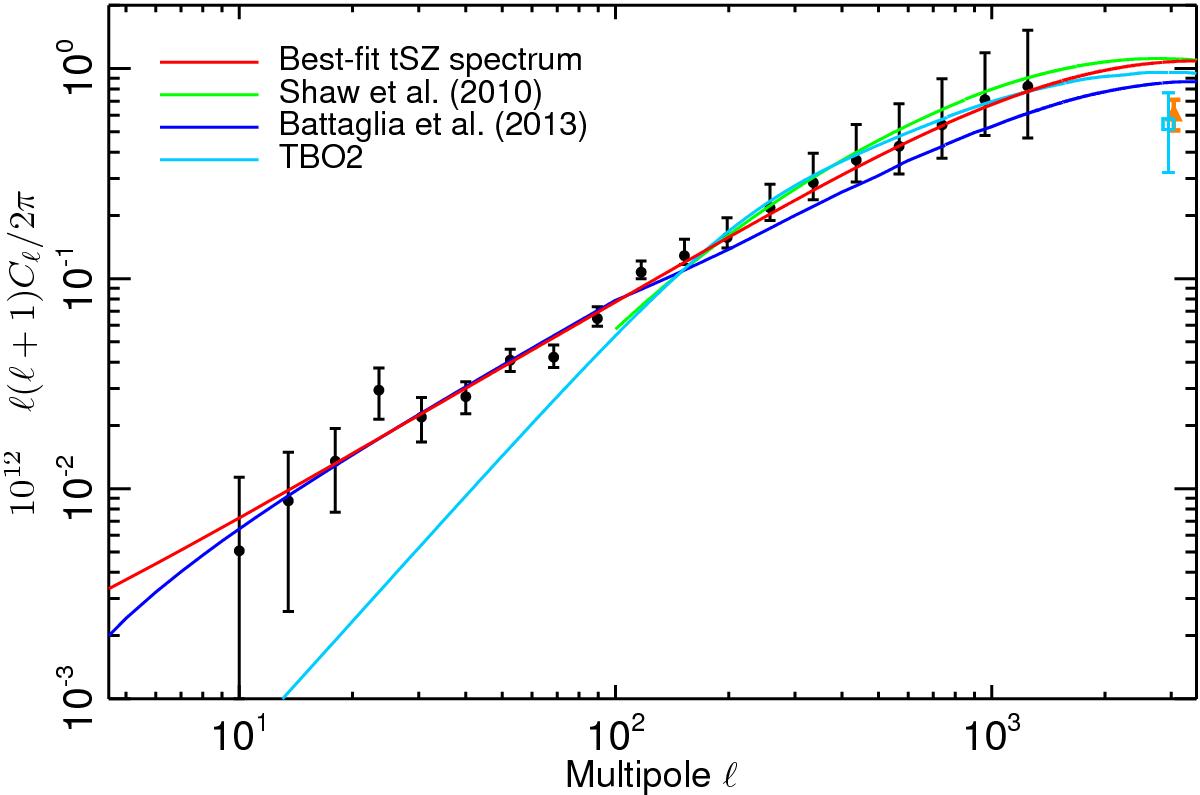
tSZ power spectrum for existing models in the literature. The NILC-MILCA F/L cross-power spectrum after foreground correction (black dots) is compared to the Atacama Cosmology Telescope (ACT; cyan dot) and the South Pole Telescope (SPT; orange, George et al. 2015) power spectrum estimates. We also show the tSZ power spectrum models from hydrodynamic simulations (Battaglia et al. 2012, blue), from N-body simulations plus semi-analytical dust and gas models (Trac et al. 2011, cyan; TBO2), and from analytical calculations (Shaw et al. 2010, green).
Current usage metrics show cumulative count of Article Views (full-text article views including HTML views, PDF and ePub downloads, according to the available data) and Abstracts Views on Vision4Press platform.
Data correspond to usage on the plateform after 2015. The current usage metrics is available 48-96 hours after online publication and is updated daily on week days.
Initial download of the metrics may take a while.