Fig. 17
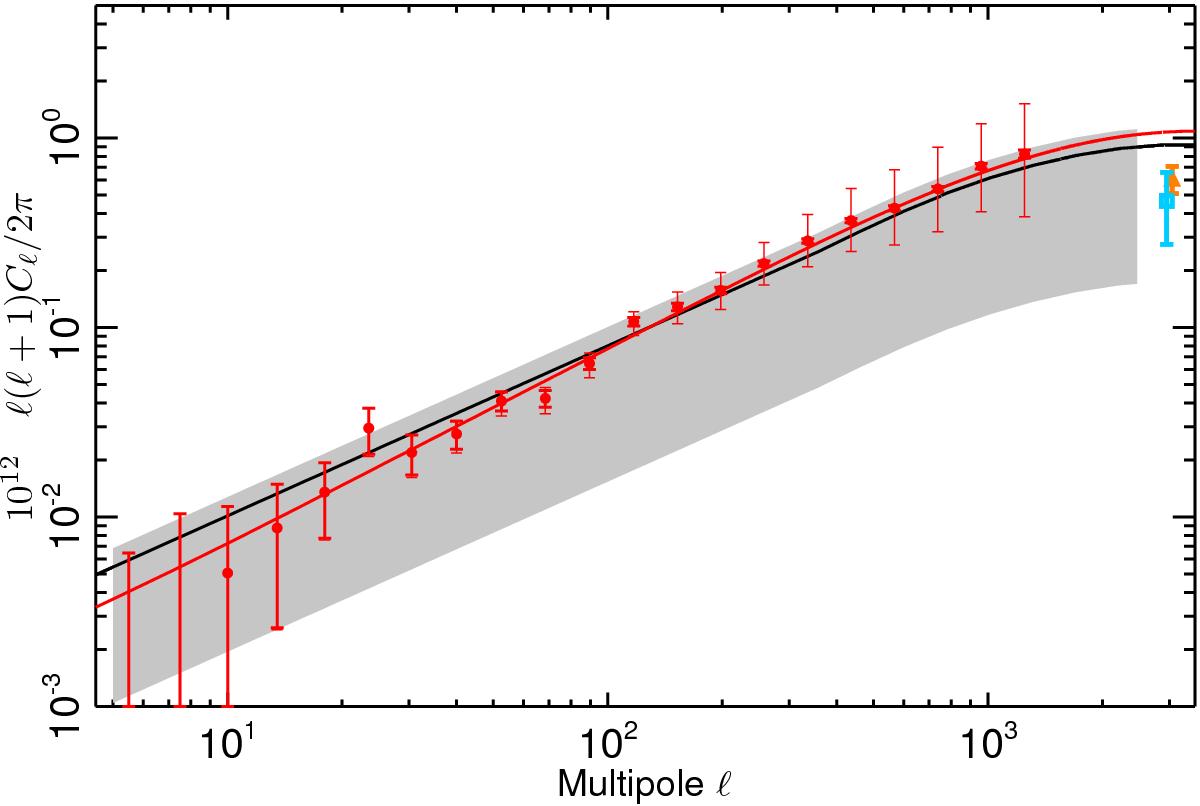
NILC–MILCA F/L cross-power spectrum after foreground subtraction (red points), compared to the Atacama Cosmology Telescope (ACT; cyan dot) and the South Pole Telescope (SPT; orange, George et al. 2015) power spectrum estimates. The black line shows the tSZ power spectrum template (EM12, Efstathiou & Migliaccio 2012) used in the Planck CMB cosmological analysis (Planck Collaboration XVI 2014; Planck Collaboration XI 2016) with its best fit amplitude AtSZ (Planck Collaboration XI 2016). The grey region allows comparison with the ±2σ interval.
Current usage metrics show cumulative count of Article Views (full-text article views including HTML views, PDF and ePub downloads, according to the available data) and Abstracts Views on Vision4Press platform.
Data correspond to usage on the plateform after 2015. The current usage metrics is available 48-96 hours after online publication and is updated daily on week days.
Initial download of the metrics may take a while.