Fig. 15
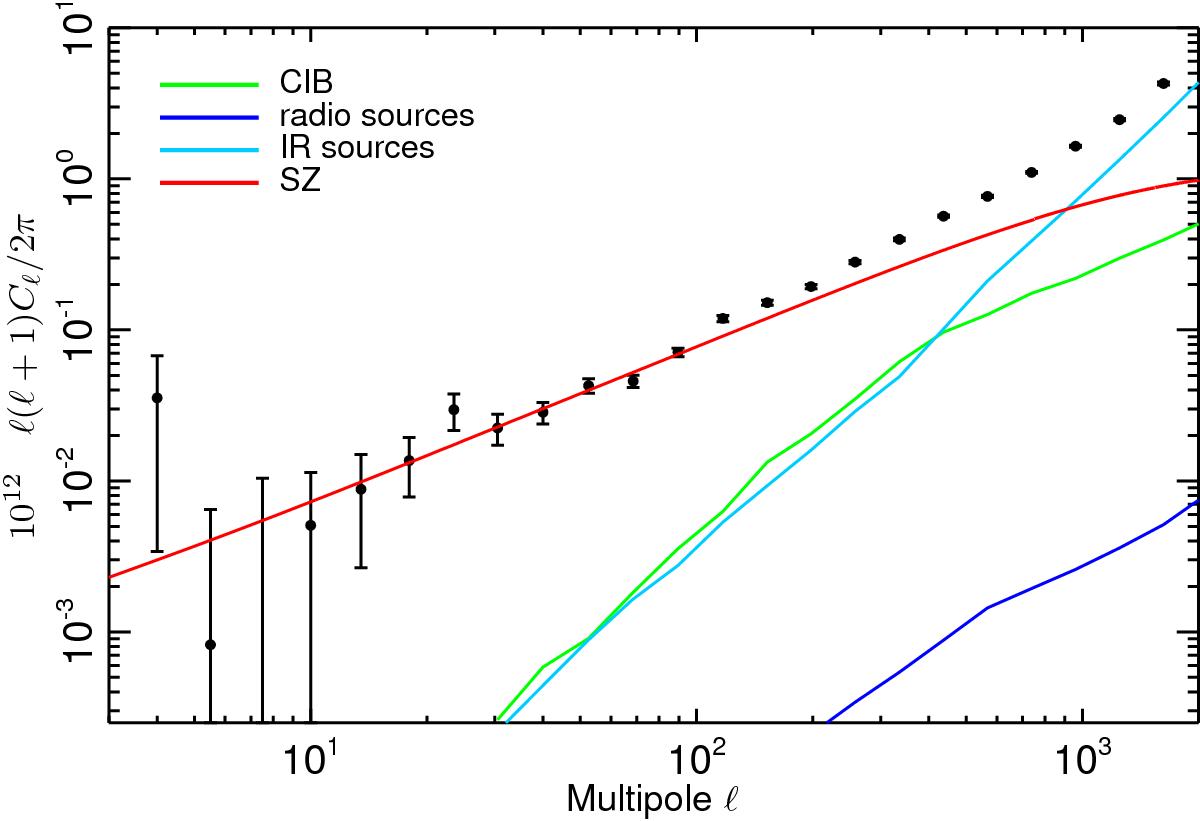
NILC - MILCA F/L cross-power spectrum (black) compared to the power spectra of the physically motivated foreground models. The foregrounds considered are: clustered CIB (green line); infrared sources (cyan line); and radio sources (blue line). Additionally, the best-fit tSZ power spectrum model presented in Sect. 7.1 is also plotted as a solid red line.
Current usage metrics show cumulative count of Article Views (full-text article views including HTML views, PDF and ePub downloads, according to the available data) and Abstracts Views on Vision4Press platform.
Data correspond to usage on the plateform after 2015. The current usage metrics is available 48-96 hours after online publication and is updated daily on week days.
Initial download of the metrics may take a while.