Fig. 12
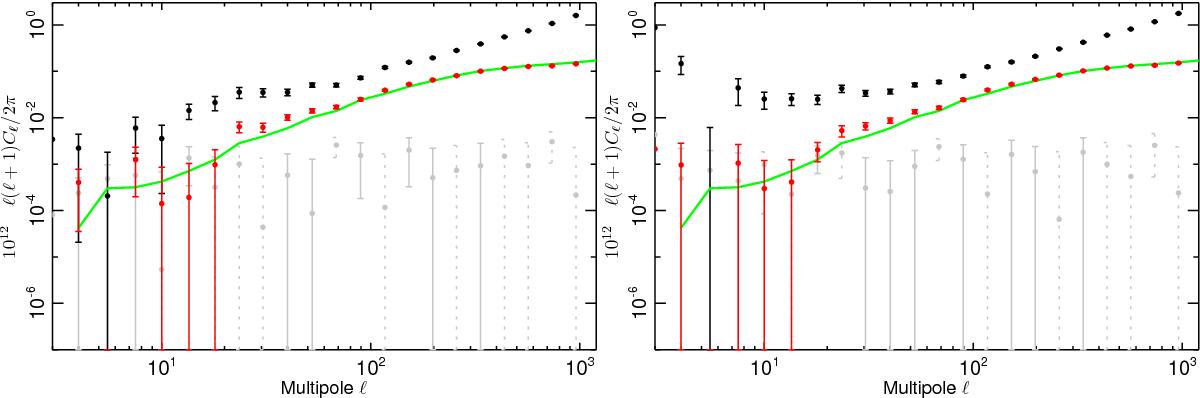
Comparison of the tSZ angular power spectrum estimated from the cross-power-spectrum of the NILC (left) and MILCA (right) F/L maps (black), with the expected angular power spectrum of the confirmed clusters in the Planck Cluster Sample (green solid line). The angular cross-power spectrum between the NILCA and MILCA Compton parameter maps and the simulated detected cluster map is shown in red. The correlation between the reconstructed y-map and the simulated detected cluster map, to which an arbitrary rotation has been applied, is plotted in grey (negative values dashed–lines for the error bars).
Current usage metrics show cumulative count of Article Views (full-text article views including HTML views, PDF and ePub downloads, according to the available data) and Abstracts Views on Vision4Press platform.
Data correspond to usage on the plateform after 2015. The current usage metrics is available 48-96 hours after online publication and is updated daily on week days.
Initial download of the metrics may take a while.