Fig. 10
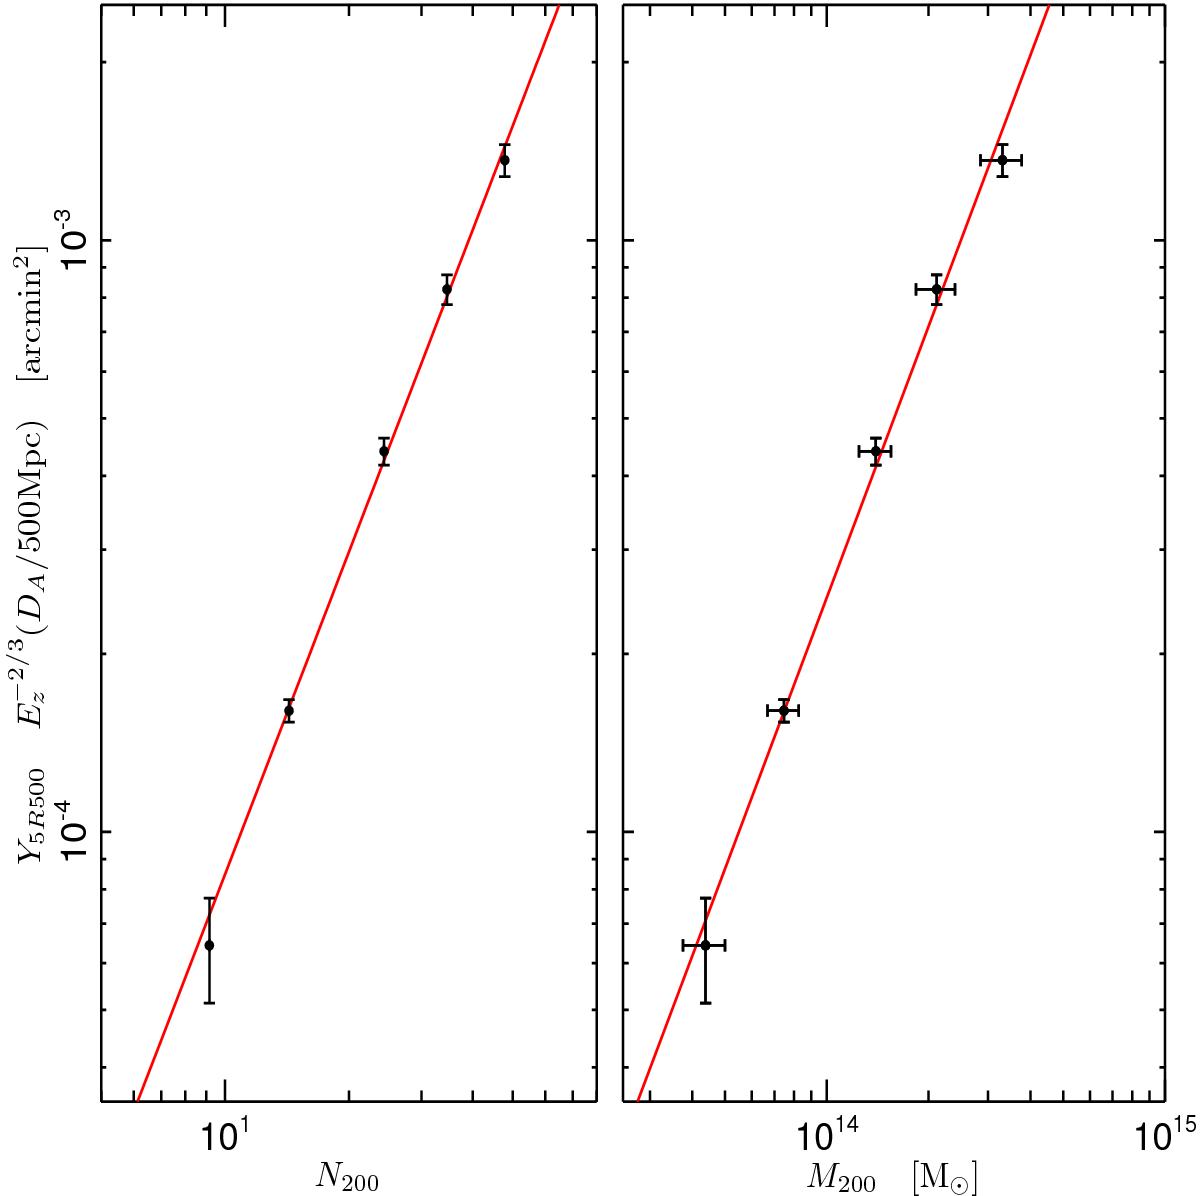
Integrated tSZ signal as a function of cluster richness (left) and total mass (right). The black points correspond to the average signal obtained for the richness bins considered in Fig. 9. The red line represents the corresponding best-fit power law (Eqs. (4) and (6), respectively). Considering z ≤ 0.42, there are 13 814 objects for 8 <N200 ≤ 10, 37 250 for 10 <N200 ≤ 20, 7458 for 20 <N200 ≤ 30, 2069 for 30 <N200 ≤ 40, and 1133 for 40 <N200 ≤ 60.
Current usage metrics show cumulative count of Article Views (full-text article views including HTML views, PDF and ePub downloads, according to the available data) and Abstracts Views on Vision4Press platform.
Data correspond to usage on the plateform after 2015. The current usage metrics is available 48-96 hours after online publication and is updated daily on week days.
Initial download of the metrics may take a while.