Fig. 4
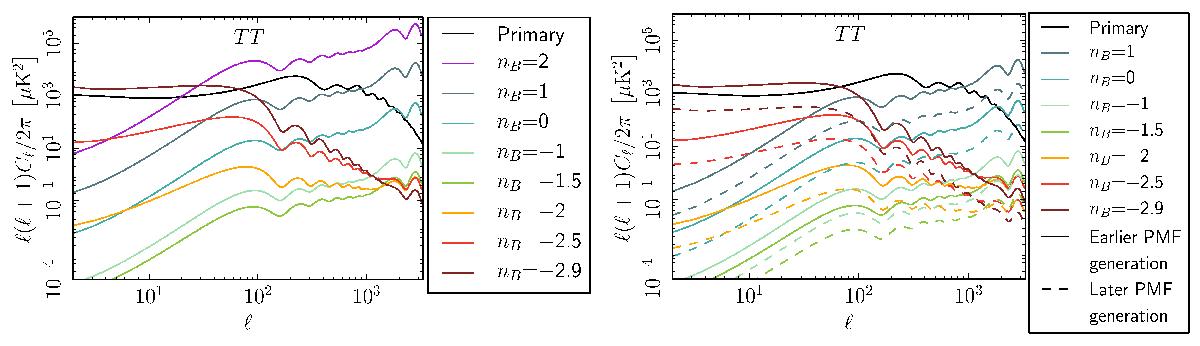
Dependence of the magnetically-induced CMB power spectrum due to passive tensor modes on the spectral index for a GUT-scale PMF (left) and comparison between the two extremes for the time ratio τν/τB (right). The black lines show the primary CMB anisotropies; for the other colours we refer to the legend. Solid lines represent PMFs generated at the GUT scale, τν/τB = 1017, whereas dashed lines represent PMFs generated at late times, τν/τB = 106.
Current usage metrics show cumulative count of Article Views (full-text article views including HTML views, PDF and ePub downloads, according to the available data) and Abstracts Views on Vision4Press platform.
Data correspond to usage on the plateform after 2015. The current usage metrics is available 48-96 hours after online publication and is updated daily on week days.
Initial download of the metrics may take a while.