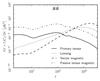
Fig. 3
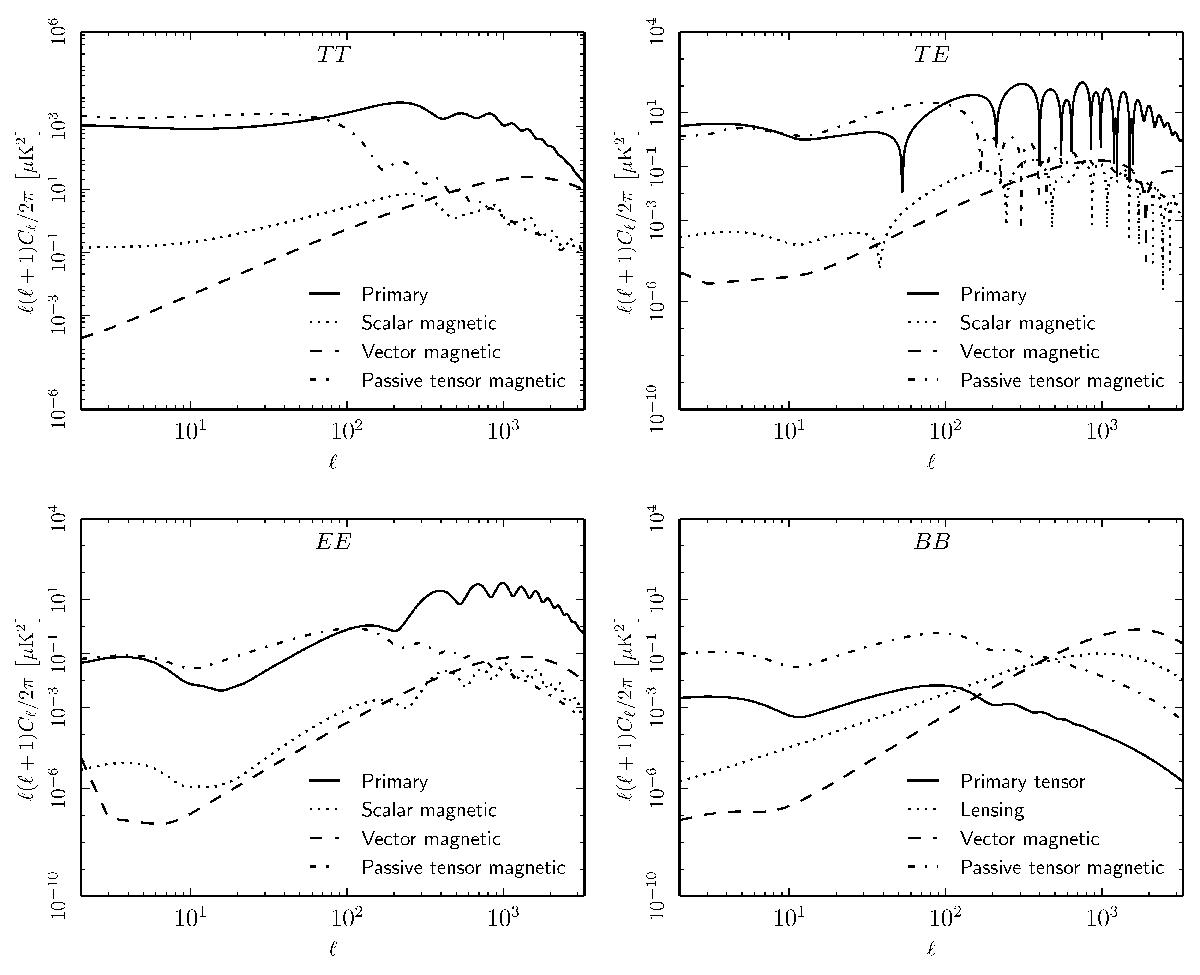
Magnetically-induced CMB TT (top left), TE (top right), EE (bottom left), and BB (bottom right) power spectra due to passive tensor modes, compared with the ones that are due to compensated modes. The solid lines represent primary CMB anisotropies, the dotted lines represent magnetically-induced compensated scalar modes (except for the BB panel, where it represents the lensing contribution), the dashed lines represent vector modes, whereas dot-dashed lines represent magnetically-induced passive tensor modes. We consider PMFs with B1 Mpc = 4.5 nG and nB = −2.9.
Current usage metrics show cumulative count of Article Views (full-text article views including HTML views, PDF and ePub downloads, according to the available data) and Abstracts Views on Vision4Press platform.
Data correspond to usage on the plateform after 2015. The current usage metrics is available 48-96 hours after online publication and is updated daily on week days.
Initial download of the metrics may take a while.