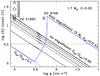
Fig. 2
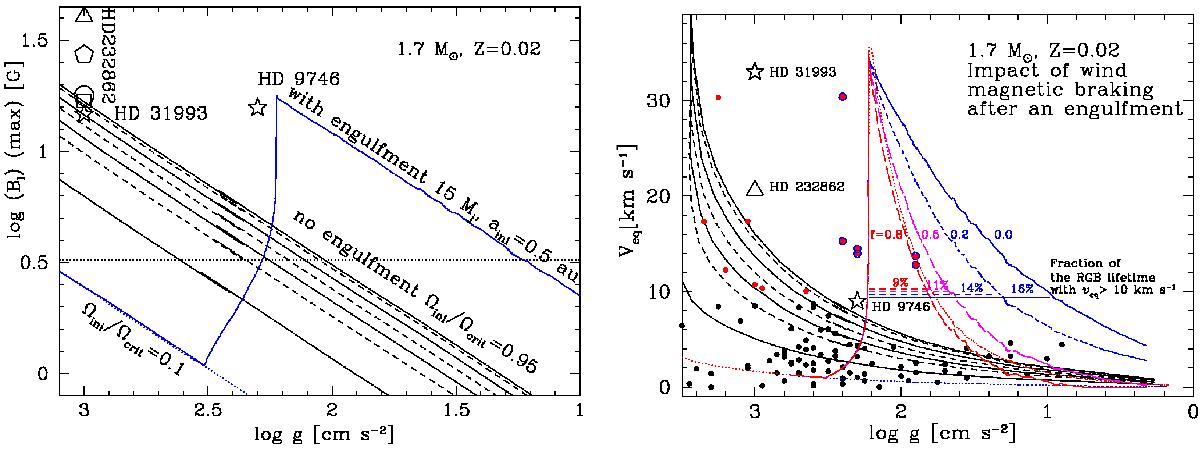
Left panel: predicted evolution of the surface magnetic field as a function of the surface gravity for 1.7 M⊙ stellar models along the red giant branch with and without planet engulfment. The models are the same as in Fig. 1. Above the horizontal dashed line, Ro < 1. The two empty stars are observations from Aurière et al. (2015). The other points correspond to the star HD 232862 observed on four consecutive days by Lèbre et al. (2009; the triangle is the first observation, then the square, pentagon, and the circle). Right panel: evolution of the surface rotation as a function of the surface gravity for the same models as shown in Fig. 1, with in additional cases where magnetic braking laws with various efficiencies have been accounted for after the engulfment. The dashed blue, magenta, and red curves correspond to values of f equal to 0.2, 0.5, and 0.8 using Eq. (2) (see text). The red dotted line is obtained using Eq. (3) with f = 0.5. The continuous blue curve corresponds to the case f = 0. We have indicated how the duration of the period during which the surface velocity is above 10 km s-1 varies as a function of the strength of the magnetic braking. The same three observations as those indicated in the left panel are shown. The dots show the observations by Carlberg et al. (2012), the black circles show the stars with a υsini< 10 km s-1, the filled red- and blue-circled magenta points have υsini> 10 km s-1. The blue-circled magenta points correspond to stars (HD 31994, Tyc 0347-00762-1, Tyc 5904-00513-1, and Tyc 6054-01204-1) whose surface velocity cannot be explained by any reasonable model for single stars (Paper II).
Current usage metrics show cumulative count of Article Views (full-text article views including HTML views, PDF and ePub downloads, according to the available data) and Abstracts Views on Vision4Press platform.
Data correspond to usage on the plateform after 2015. The current usage metrics is available 48-96 hours after online publication and is updated daily on week days.
Initial download of the metrics may take a while.