Fig. 9
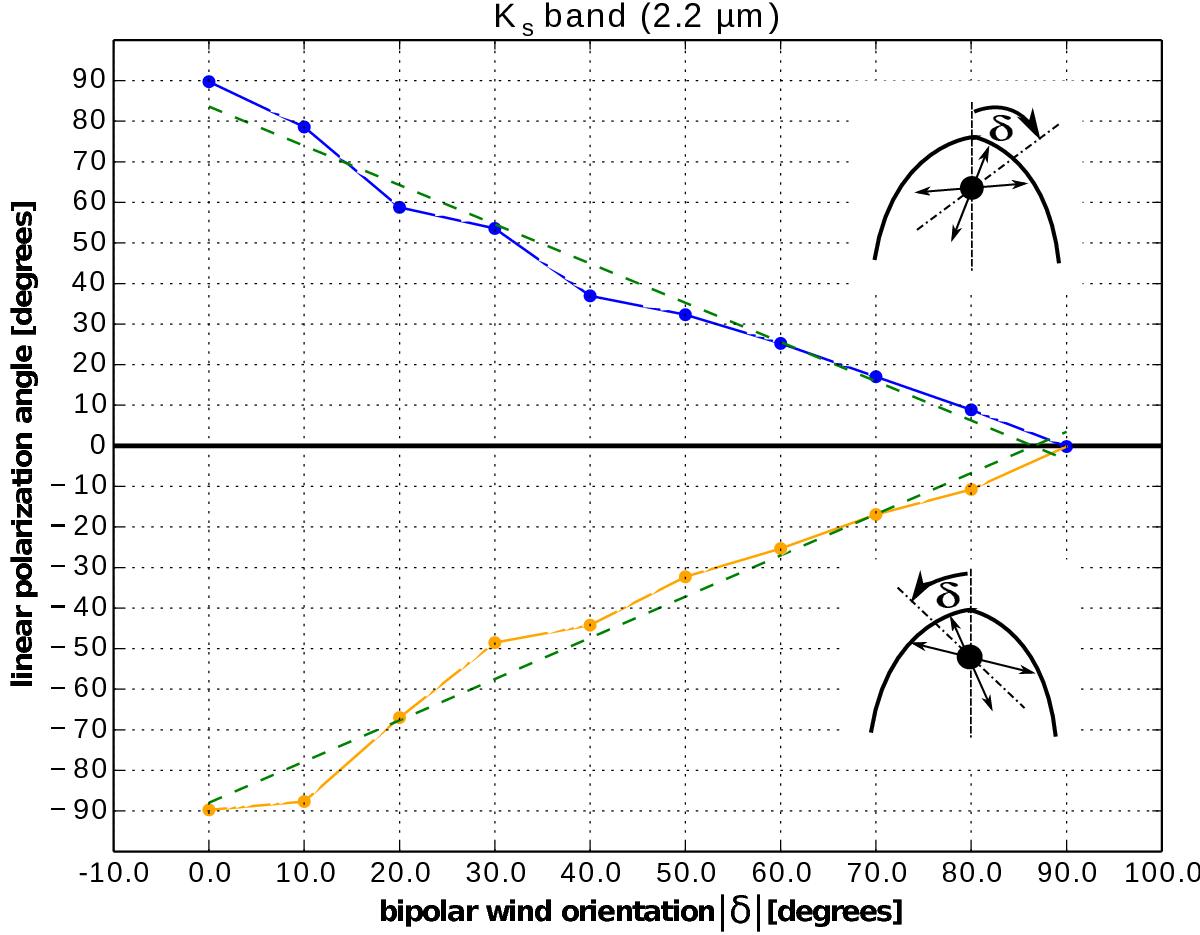
Linear polarization angle as a function of bipolar wind orientation δ. The plot consists of two parts: the upper panel shows the dependence for the clockwise rotation of the bipolar wind; the lower panel is the same dependence for the counter-clockwise rotation of the bipolar wind. The lines correspond to the linear interpolation of the data; linear regression lines are depicted by green dashed lines.
Current usage metrics show cumulative count of Article Views (full-text article views including HTML views, PDF and ePub downloads, according to the available data) and Abstracts Views on Vision4Press platform.
Data correspond to usage on the plateform after 2015. The current usage metrics is available 48-96 hours after online publication and is updated daily on week days.
Initial download of the metrics may take a while.