Fig. 6
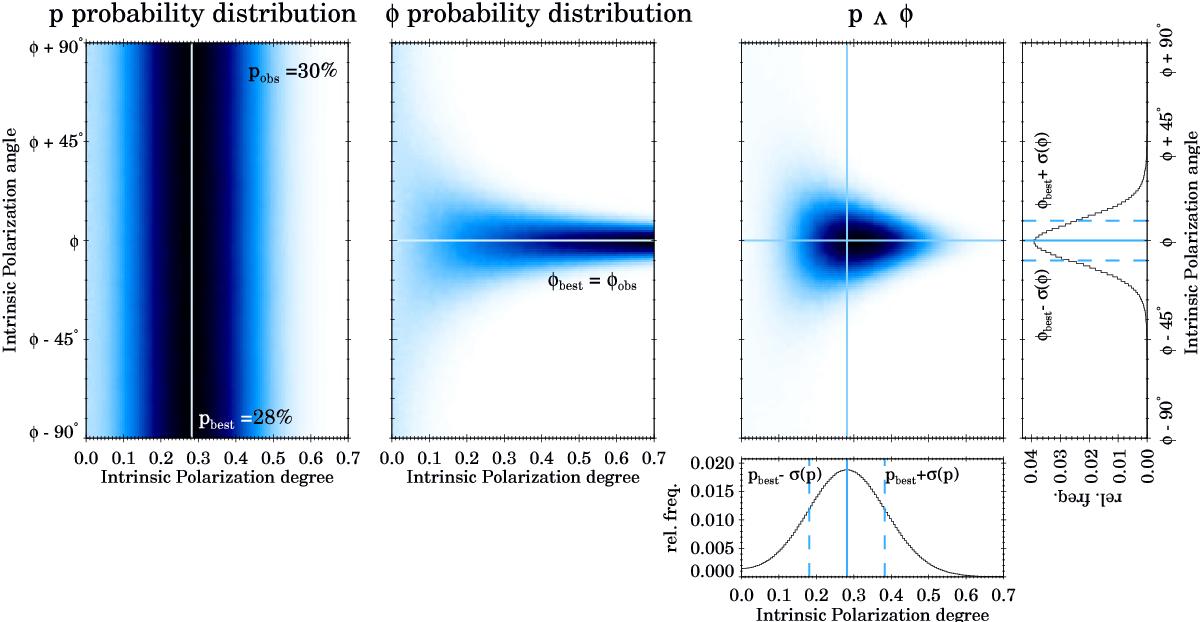
Left: marginalized distributions of intrinsic polarization degree and angle, assuming that the observed values are the most probable ones. Here the case of 2008 data is shown. Right: combined probability obtained from the two distributions at the left. The bottom and right panels show transversal cuts to the combined distribution at the position of the marked lines.
Current usage metrics show cumulative count of Article Views (full-text article views including HTML views, PDF and ePub downloads, according to the available data) and Abstracts Views on Vision4Press platform.
Data correspond to usage on the plateform after 2015. The current usage metrics is available 48-96 hours after online publication and is updated daily on week days.
Initial download of the metrics may take a while.