Fig. 5
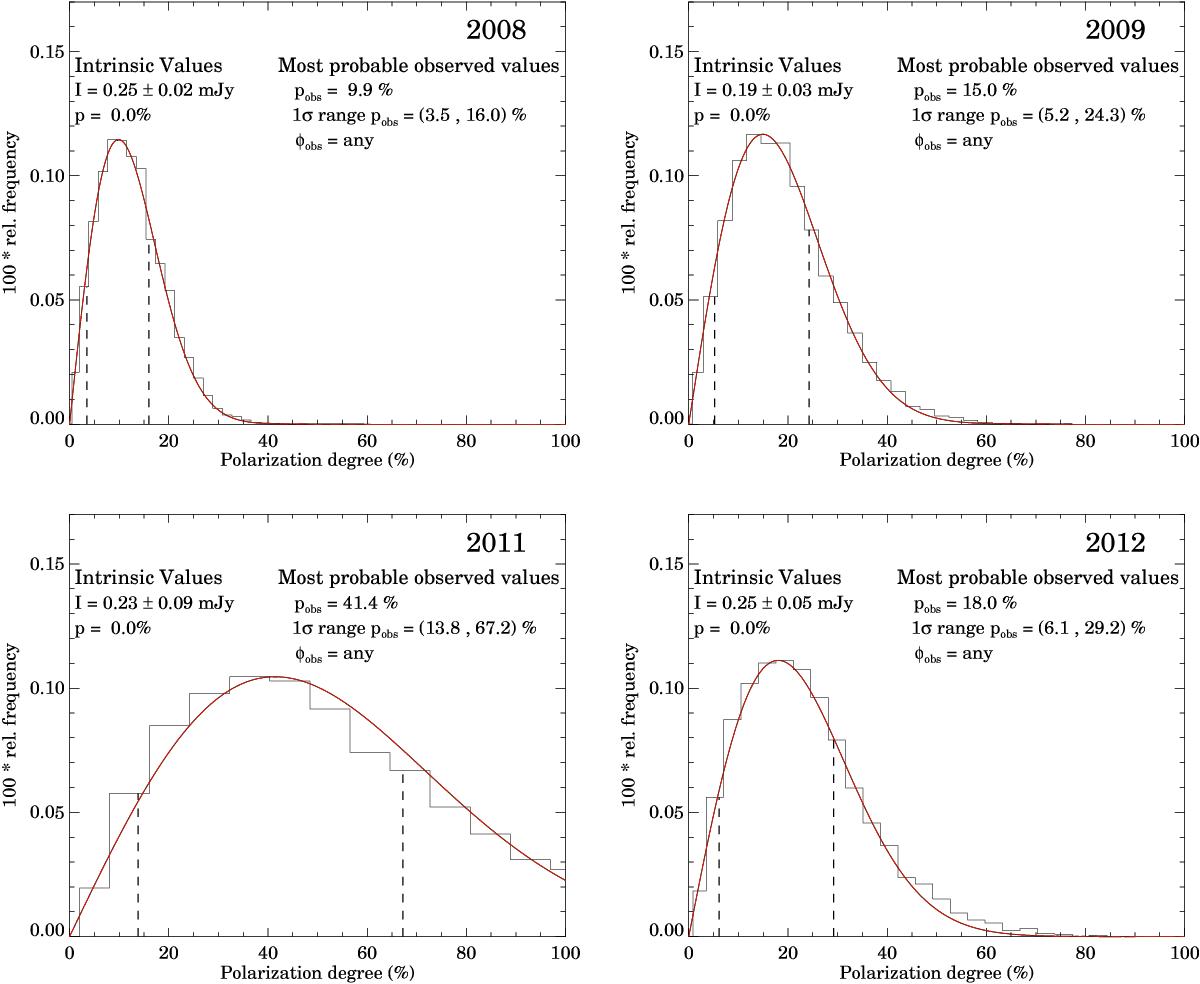
Polarization degree distribution for the observations in 2008, 2009, 2011, and 2012 when considering the null hypothesis (p = 0%, φ = 0°), the observed flux density I, and its uncertainty. The most probable observed polarization degree, pobs in each case is the mode of the distributions. The range that contains 68% of the most probably observed values, 1σpobs is delineated with vertical dashed lines. The smooth line over the histograms corresponds to the best-fit Rice function.
Current usage metrics show cumulative count of Article Views (full-text article views including HTML views, PDF and ePub downloads, according to the available data) and Abstracts Views on Vision4Press platform.
Data correspond to usage on the plateform after 2015. The current usage metrics is available 48-96 hours after online publication and is updated daily on week days.
Initial download of the metrics may take a while.